Table of Contents
Brief overview1. The stats tab1.1 Viewers and viewing time1.2 Traffic acquisition1.2.1 Traffic acquisition measurement1.3 Track your Live engagement1.4 Track your Post-live engagement1.5 Track your interaction KPIs2. KPIs analysis 3. Conversion tracking 3.1 Which show attributes the purchase?4. DataLayer - Extend your show analysisBrief overview
What is success for you, and how do you know if the show was successful or not. These questions are essential for you to answer internally, and our stats page includes all you need to analyze the performance. In this section, you’ll learn how to measure the results of your live video shopping streams and optimize your workflow for the next event. Head over to our article on how the stats are calculated for in-depth information on each KPI.
1. The stats tab
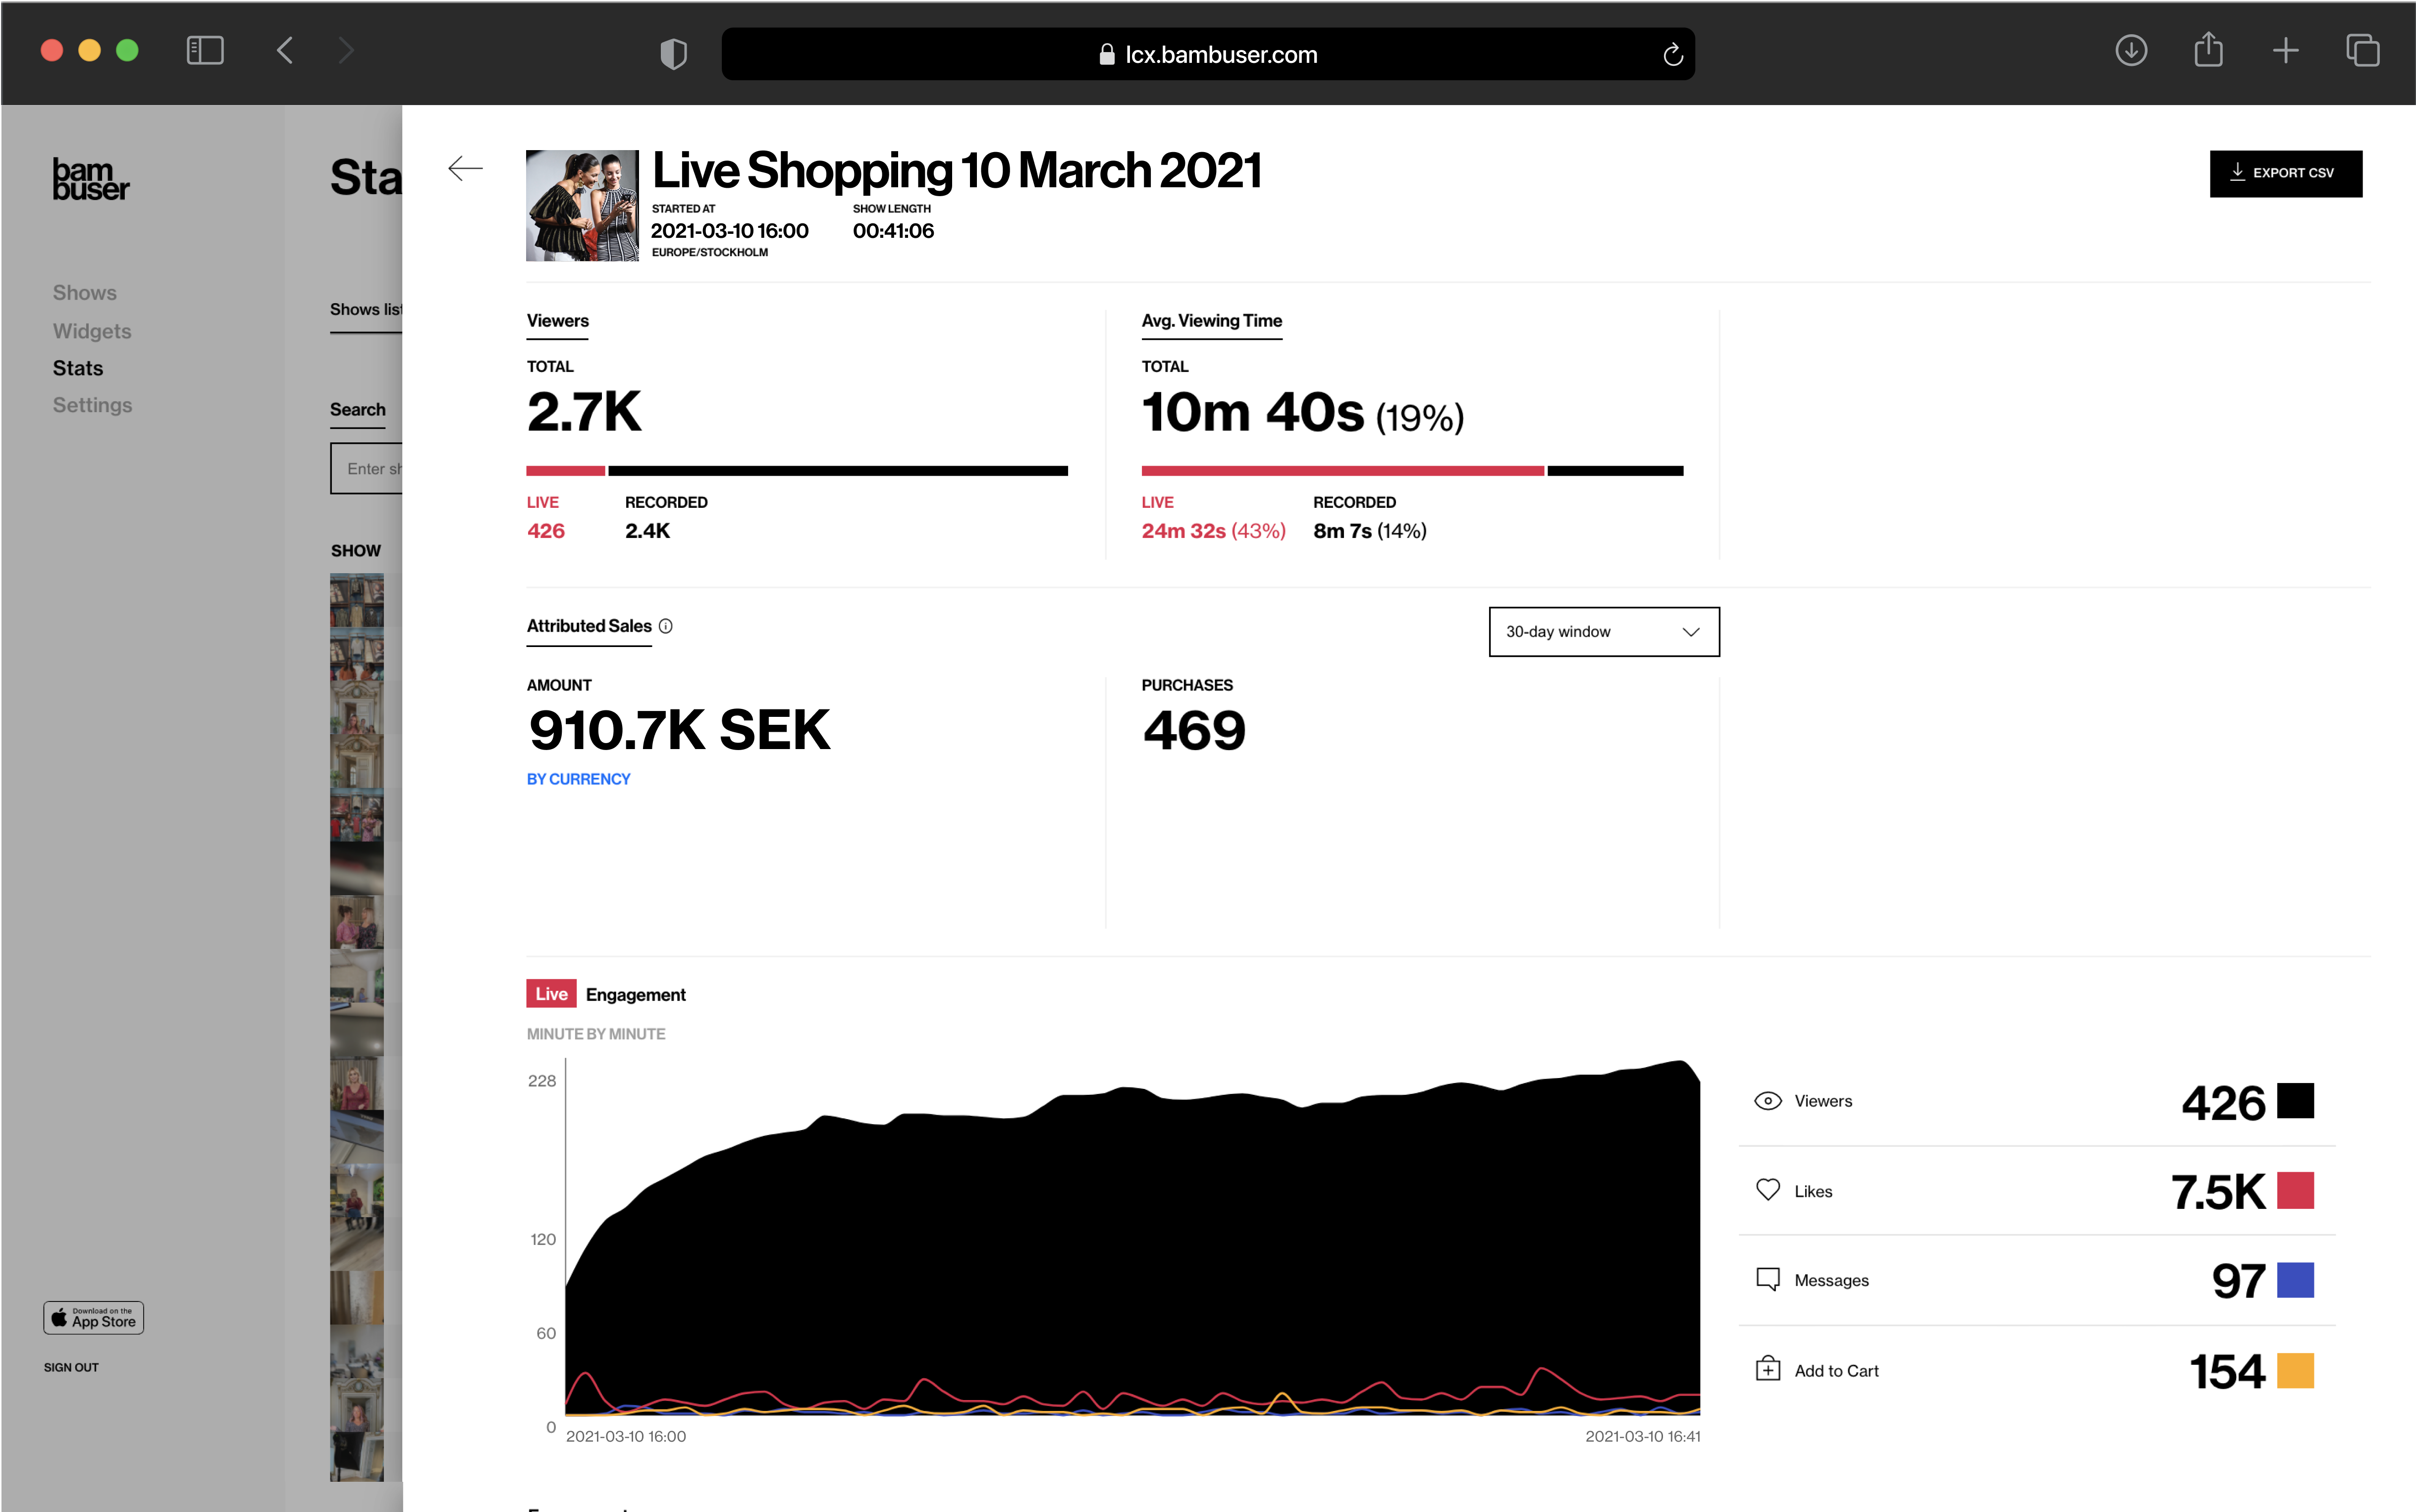
The Dashboard will give you a full overview of your show statistics, covering both Live, recorded, and total performance. We recommend you to always go through the stats after a live to understand the viewer's behavior, what content is most engaging, and what triggers their purchases during the show.
- Time and duration
- Number of viewers
- Likes
- Chat
- Add-to-cart
- Mobile vs Desktop engagement
- Purchases
If you would like to know more about the export CSV, read more here.
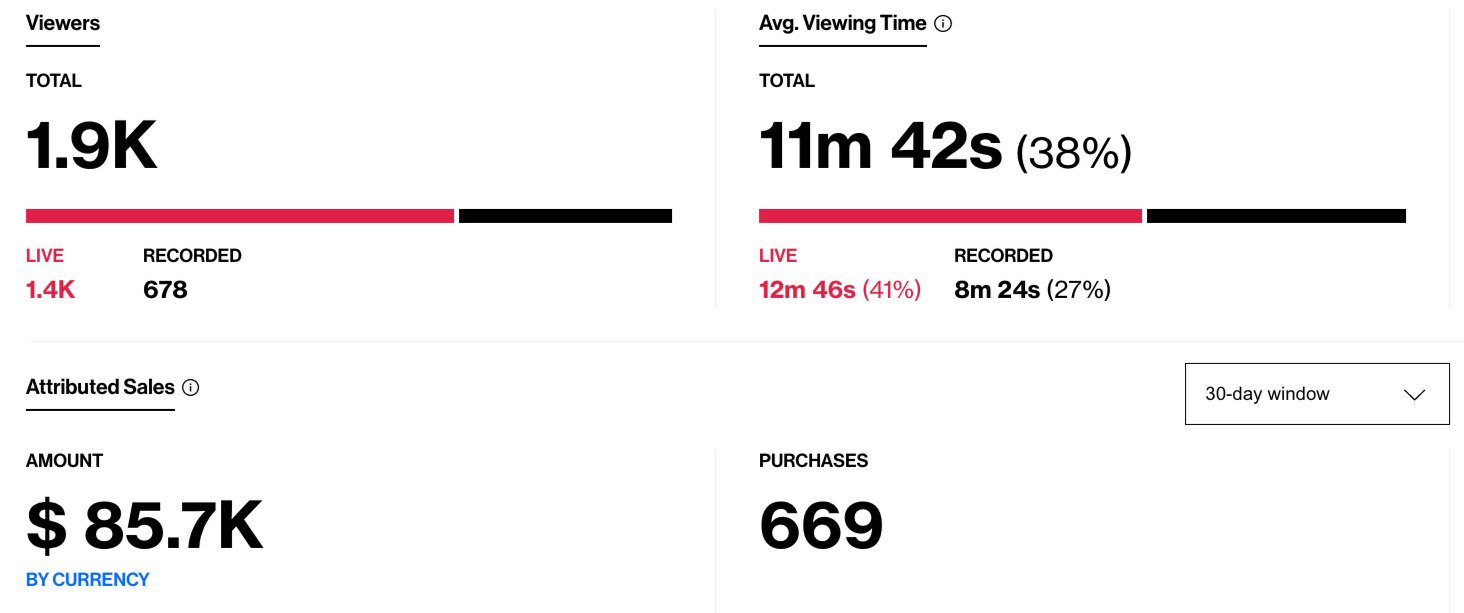
1.1 Viewers and viewing time
For viewers and viewing time you can also examine the following:
- Live stats from the actual live show
- Recorded stats from all views of the recorded show (updated every 24 hours)
- Total stats of both live and recorded
1.2 Traffic acquisition
If you are streaming simultaneously to for instance Facebook, YouTube & or more, you can analyze viewers' that clicked on the chosen streaming platform and examine the funnel.
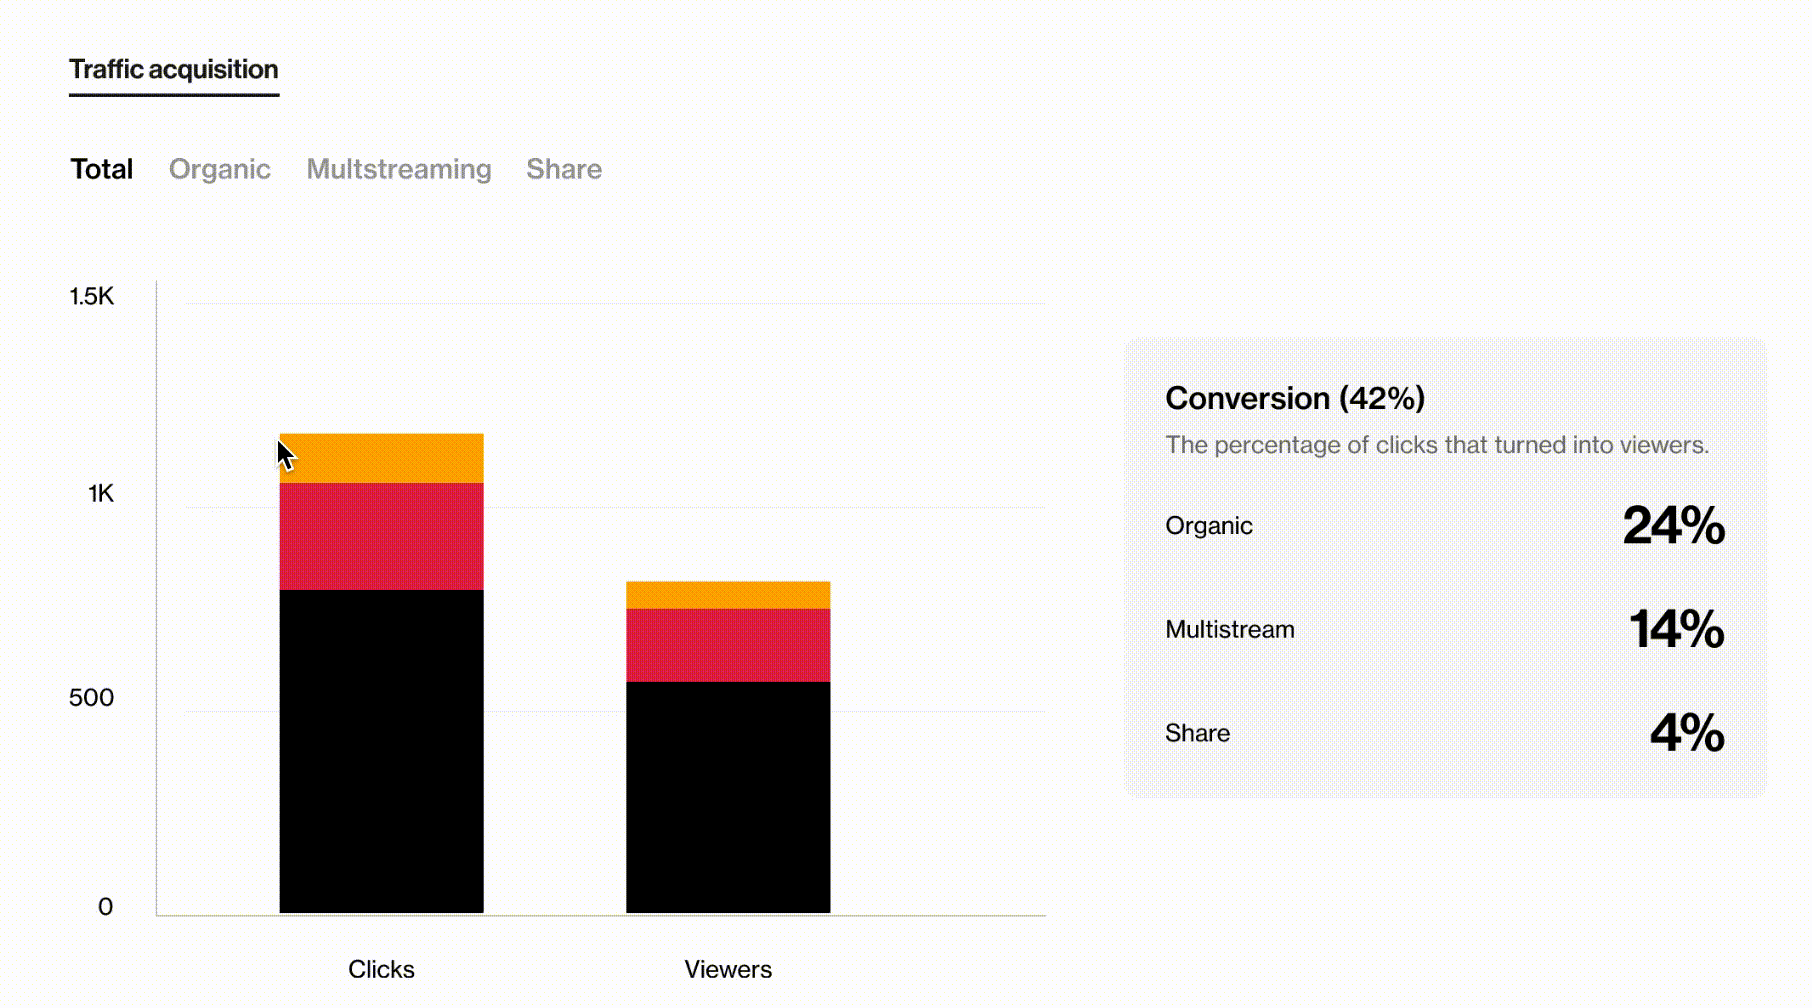
The stats provide visibility, both through graphs and a conversion panel, on clicks, viewers, click to viewer conversion at group and sub-group categories levels. The different traffic sources have been organized with the following hierarchy:
|
Total
|
Organic
|
Multistream
|
Share |
1.2.1 Traffic acquisition measurement
Before going into details about definitions and classifications please keep in mind that Bambuser can only track traffic taking place on the Bambuser domain; e.g. a view on Facebook will not be counted and so not included in the numbers presented.
1.2.1.1 Definition
Clicks: A person clicking to start the loading of the video but not waiting for the loading to finish generates a click.
Viewers: A person who has clicked on the video, waited for the loading to finish, and therefore with some viewing time of the show ( no rules applied like minimum viewing time of XX seconds) is counted as a viewer.
Clicks/viewers are unique per source (e.g. a viewer accessing the show through Facebook and then through Youtube will be counted once per source). This might lead to the sum of total viewers being greater than the total viewers of the show.
1.2.1.2 Classification of main traffic source:
Organic:
All the click/viewer activity happening directly on the customer’s website (Direct/ Channels/ FAB) is counted as Organic
-
Multistreaming and Share classification:
If the URL to live show contains socialMediaLiveshopping then the click/viewer is counted as Multistreaming.
If the URL to live show contains shareLiveshopping then the click/viewer is counted as Share.
If the URL to live show contains both socialMediaLiveshopping and shareLiveshopping, the socialMediaLiveshopping will trump the shareLiveshopping and hence the click/viewer is counted as Multistreaming.
In case the URL to live show does not fulfill any of the above Multistreaming/ Share specifications, then the click/viewer is counted as Organic-Direct traffic
Please note:
To optimize the traffic acquisition data classification, we have “reserved” the following url parameters shareLiveShopping and socialMediaLiveshopping.
To ensure that the correct number of viewers is captured, all the clicks registered from when the show is created are counted and included in the graphical visualization and conversion calculation. That should be kept in mind while evaluating the conversion metrics (eg, an extremely high pre-show clicks activity, even if it is absolutely a positive event, might slightly lowering down the conversion rate)
If the player is configured with the autoplay setting, it automatically generates the tracking events used to classify both clicks and viewers.
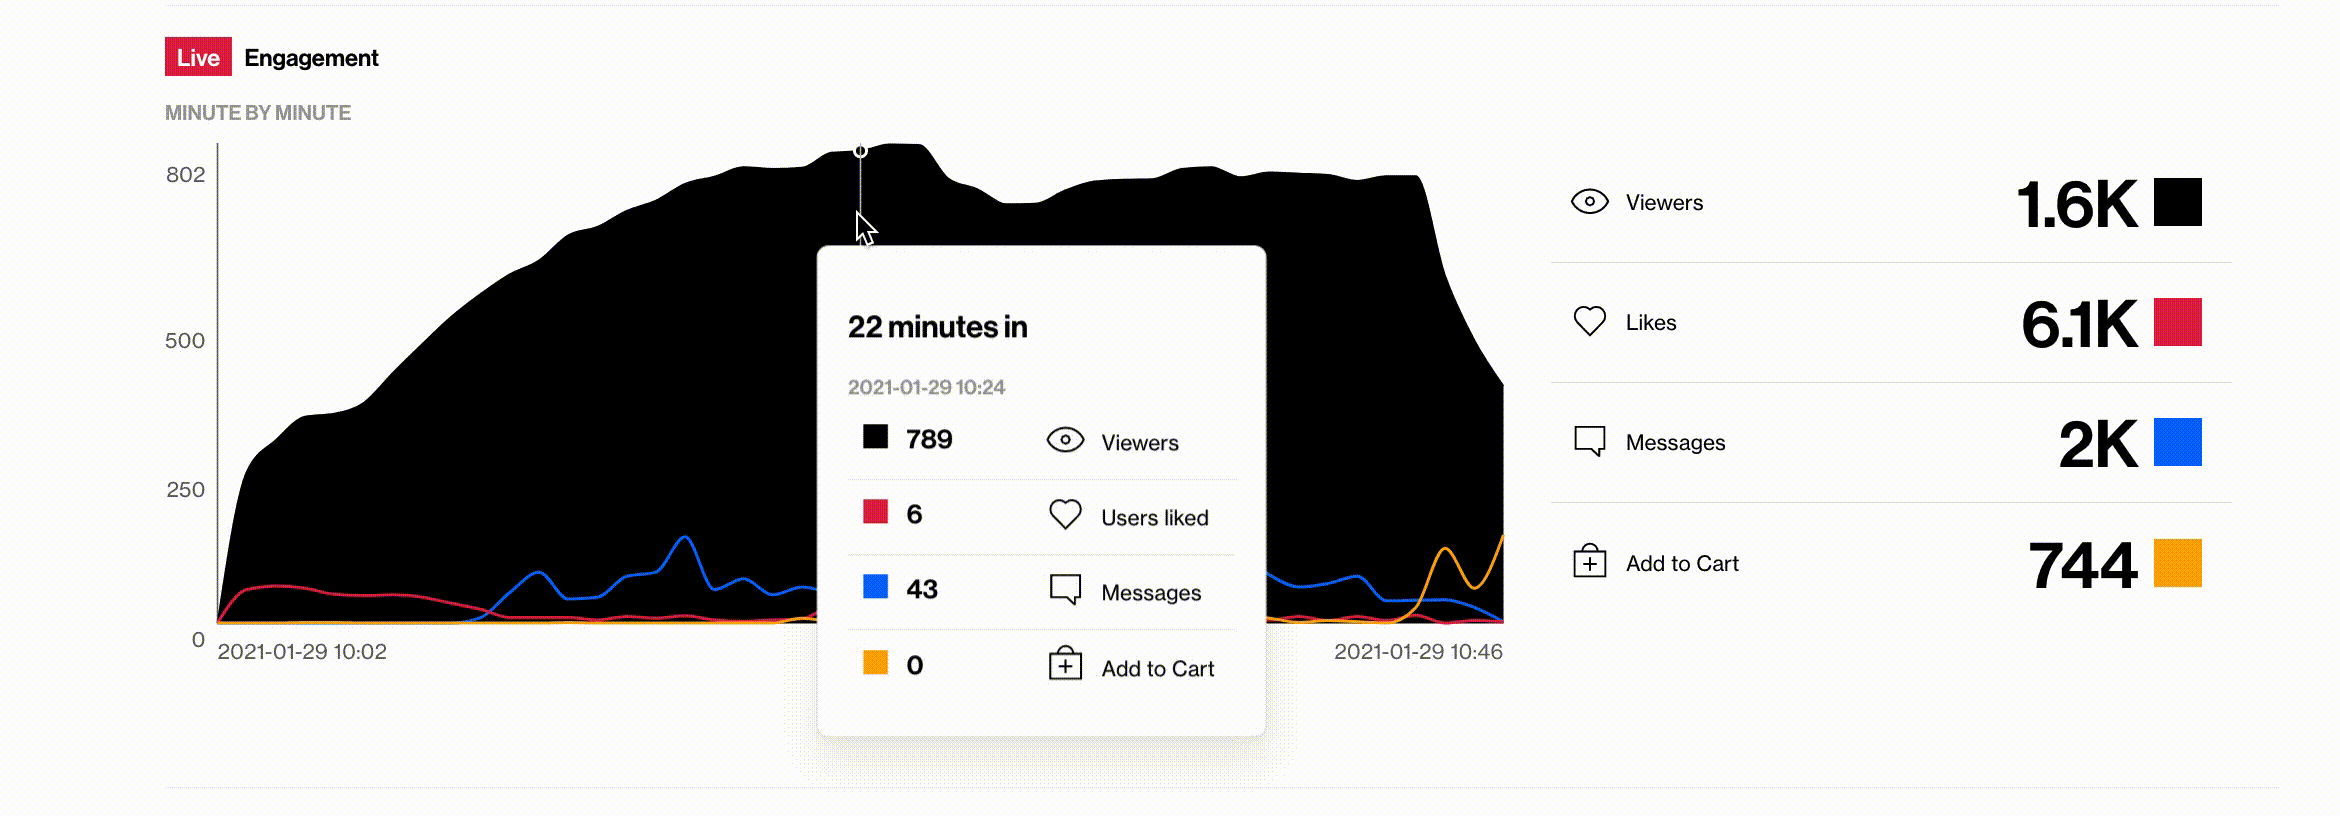
1.3 Track your Live engagement
The live engagement graph showcases the viewers' interaction minute by minute of the show. Learn from the curves and identify what content triggers their actions.
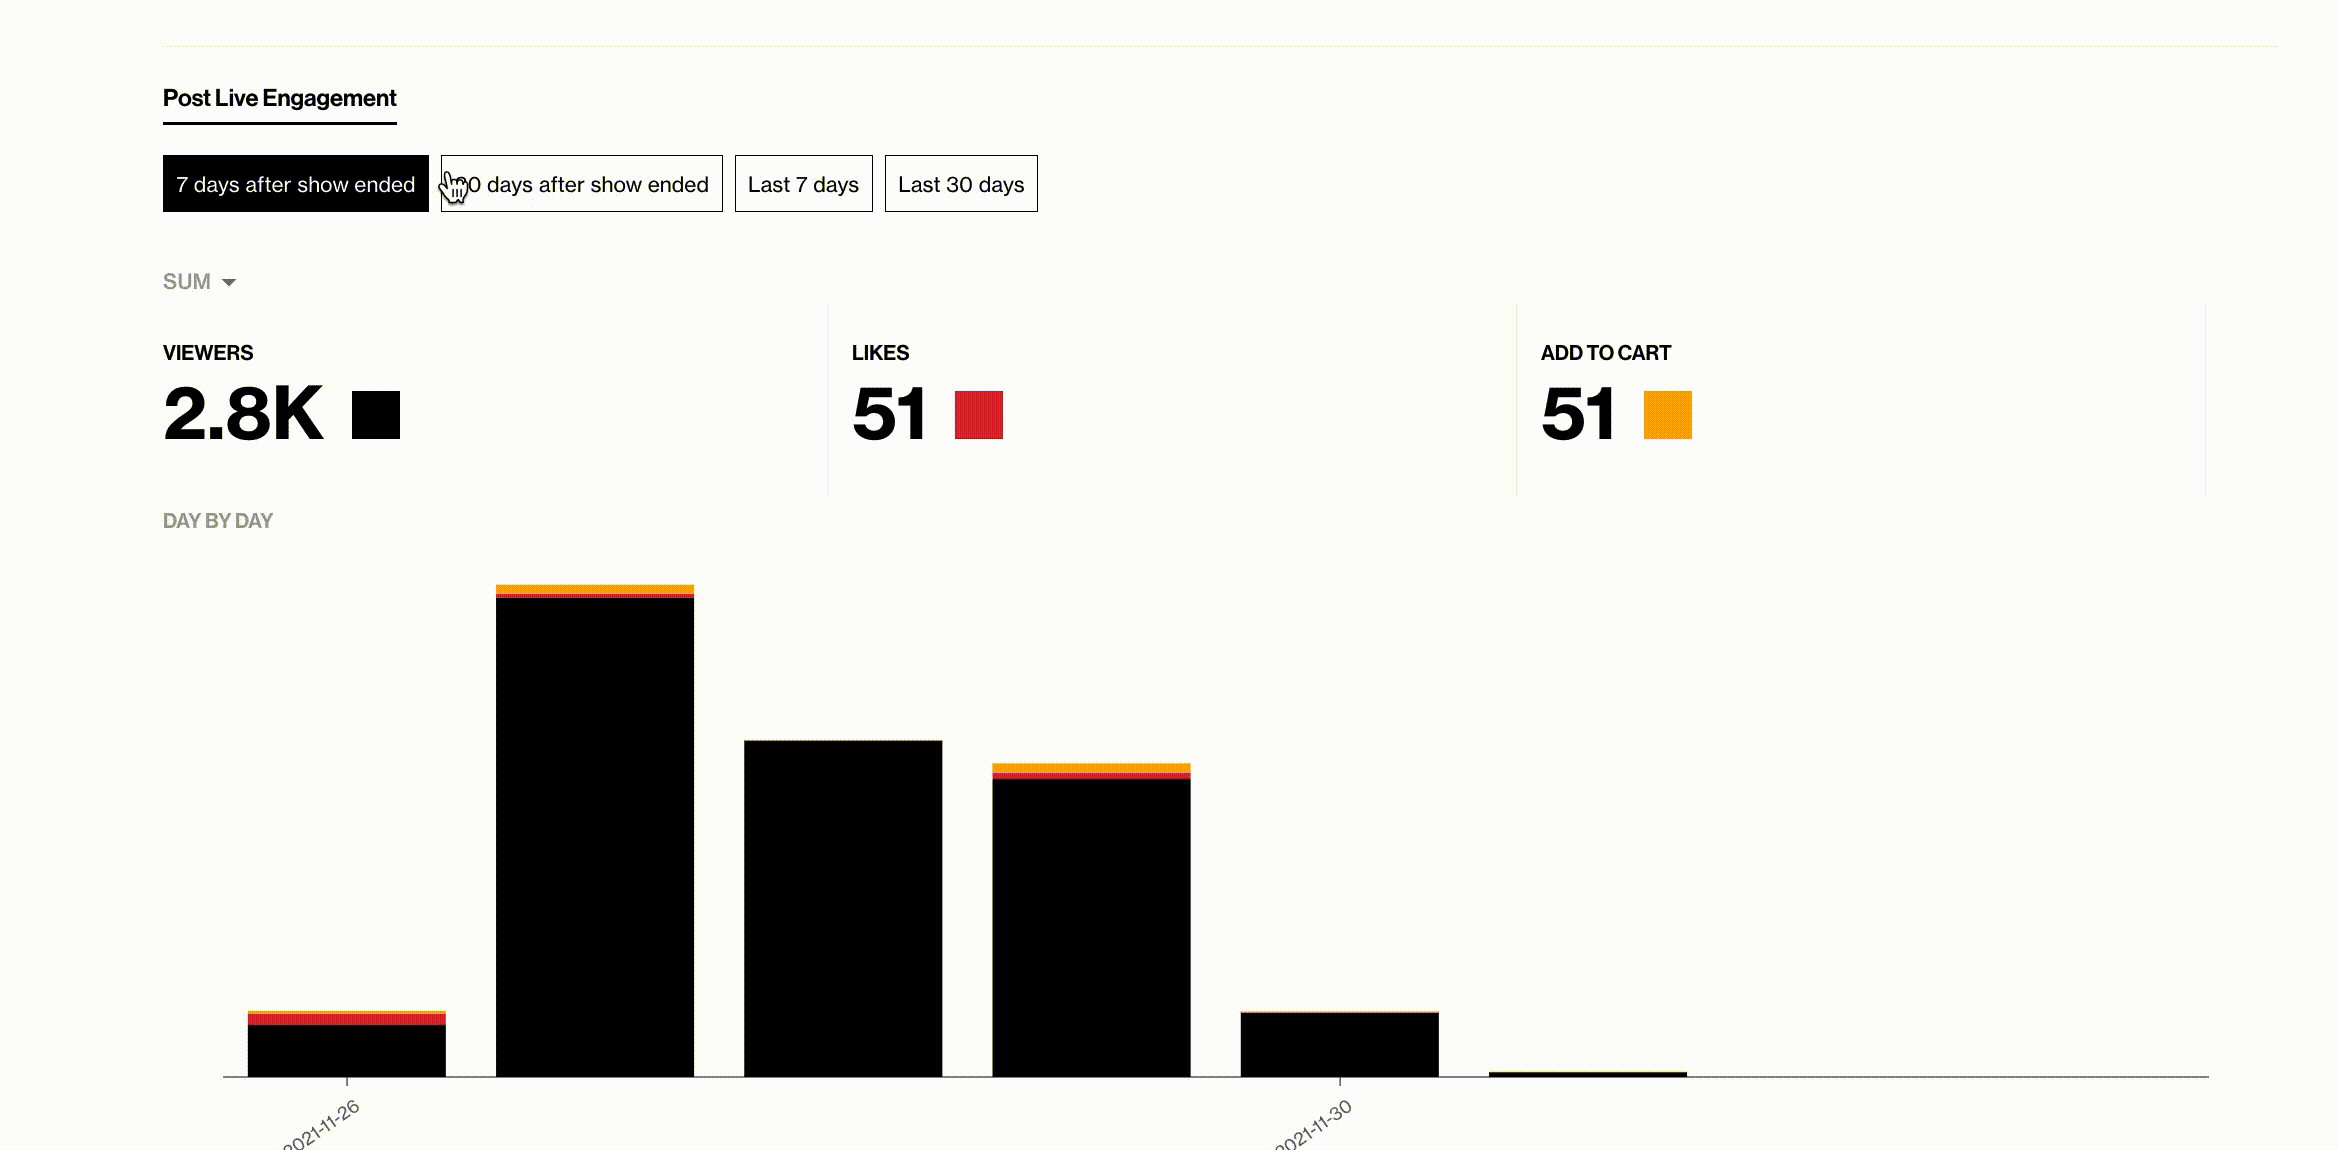
1.4 Track your Post-live engagement
The post-live engagement graph showcases the viewers' interaction after the show has been live. You can filter between different time periods and select sum, max, and average.
1.5 Track your interaction KPIs
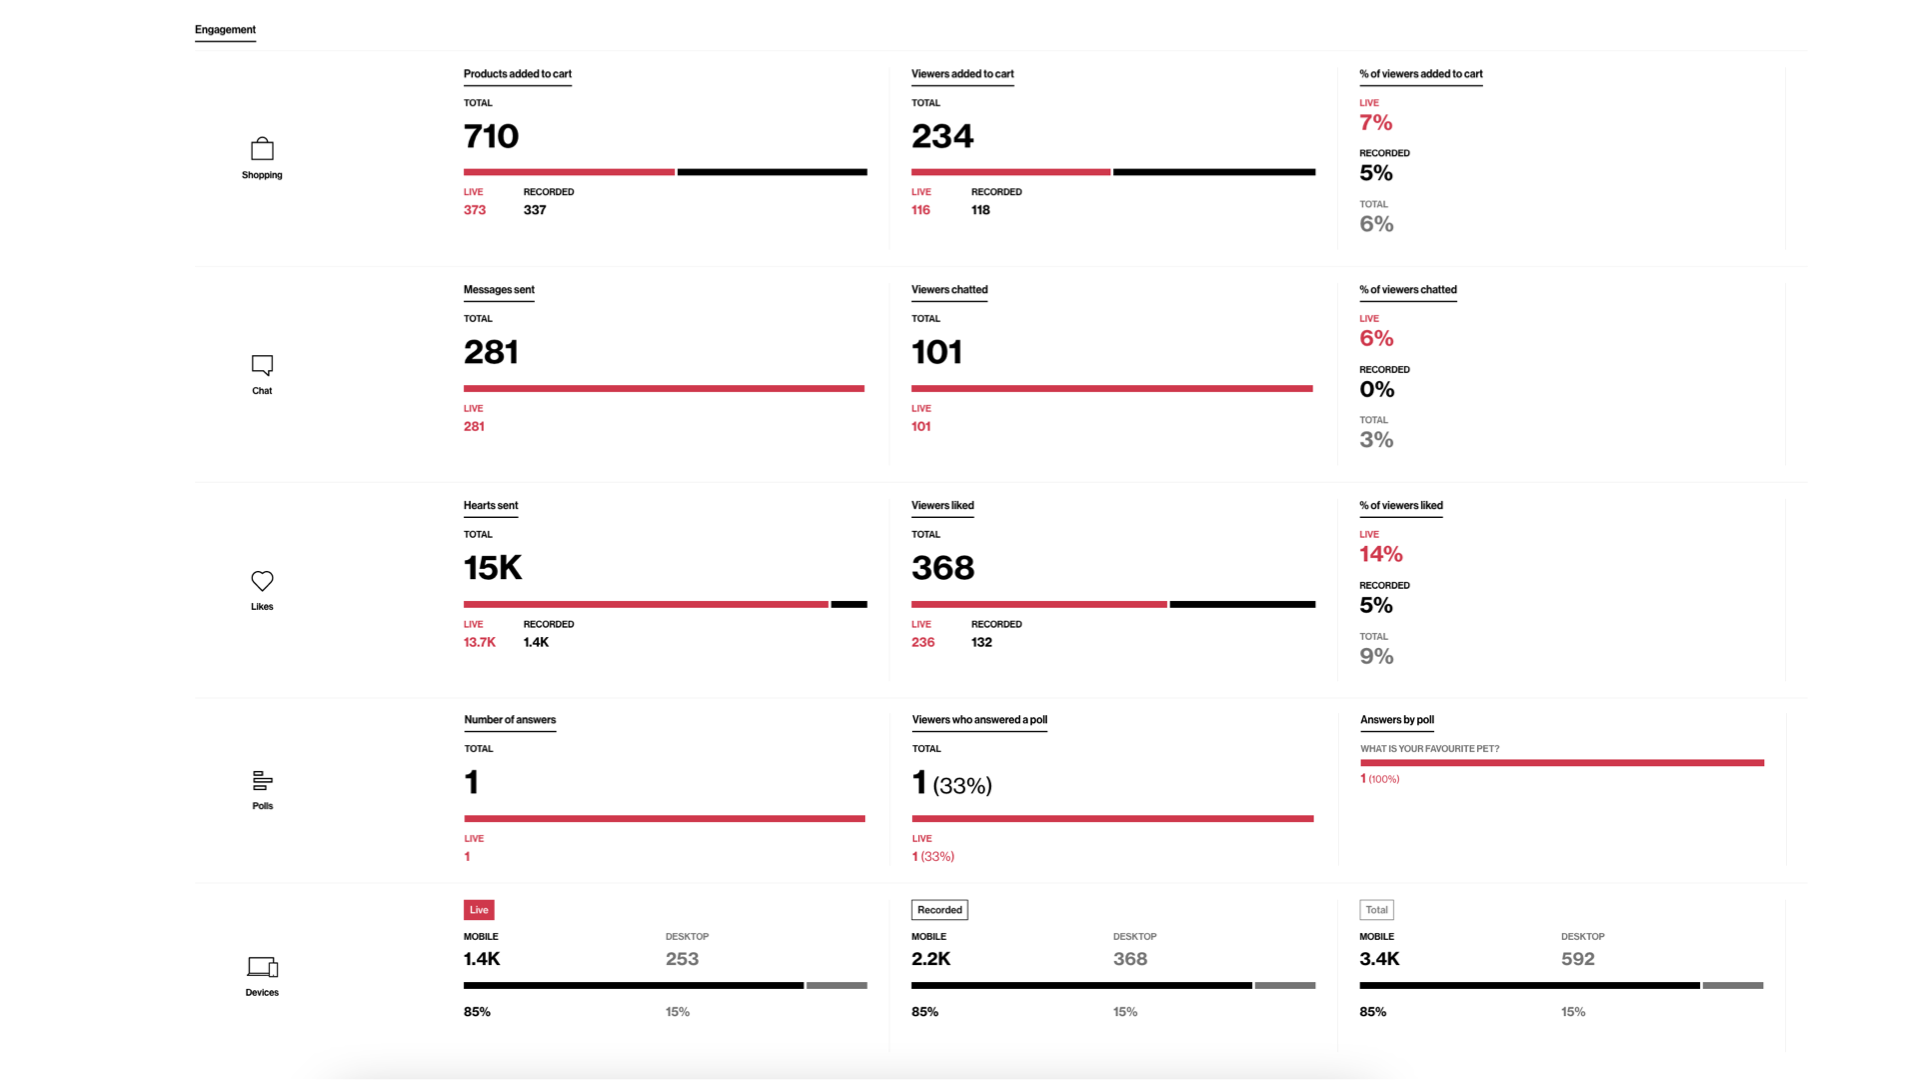
- Add-to-cart: Showcase how well the host sells the products and if the targeted viewers are attracted to the live show (only with cart integration!)
- Chat: Live shopping is two-way communication, and the chat rate indicates if you've been successful with the interaction with the viewers
- Likes: Indicate how engaged the viewers are and if they like what they see
- Polls: Indicates a high level of engagement with the polls (number of answers, number of unique viewers answering, and number of answers by-poll). The clickable last widget allows to be redirected (in a new tab) to the moderator page and to see how the shoppers answered the selected poll in detail.
- Device: Divided between desktop and mobile
2. KPIs analysis
Discover how to increase the live viewer count by using the Bambuser Floating Action Widget. Learn more here on how you can boost your traffic!
- Average viewing time - How well are you engaging and keeping the viewers during the show. Catch their interest and make sure to interact with them, and involve them in the topics.
Average viewing time is calculated by the total number of viewed seconds of a segment (total / live/recorded) divided by the total number of sessions during the same segment.
- Likes - Indicate how engaged the viewers are and if they like what they see.
- Chat - Live shopping is two-way communication, and the chat rate indicates if you've been successful with the interaction with the viewers.
- Add-to-cart - Showcase how well the host is selling the products and if the targeted viewers are attracted to the live show.
- Sales - Total about of sales that have been purchased in and outside the player in your currency. Choose "by currency" to see the split of you covering currencies. Select either a 7- or 30-days window for the attributed sales.
- Purchases - A total amount of the purchases that have been made in and outside the player.
3. Conversion tracking
A purchase defines as when a visitor to your website has watched a live shopping show within the past 30 days and makes a purchase on your site.
3.1 Which show attributes the purchase?
Bambuser will attribute the purchase to the last watched show, e.g., if a consumer is watching multiple shows, it’ll track sales to the latest viewed show. If it has been more than 30 days since the visitor last watched a show on your website or has not watched any live show, the purchase will not be connected to your live show.
Since some actions related to the Live Shopping experience occur outside of the player (most notably purchases), Bambuser needs complementary information to provide a holistic view of how your live streams affect your sales.
Implementing the Bambuser conversion tracking script provides you with the following added value:
- Visibility on attributed sales for 7 and 30 days post-show as well as per show. The data is available in total and by currency.
- Real-time updates on sales during live shows in the Moderator View
- Access to data layer objects enables you to import live video shopping data into their Google Analytics for further analysis and integration with internal data. The data includes:
- All purchase events attributed to their shows
- All events related to viewer interactions with the player
To get the most value out of Bambuser Live Shopping, use Bambuser's tracking library. The tracking library is a JavaScript library you can use to send relevant data to your Live Shopping performance tracking.
Tracking Library: You can learn more about the tracking library here.
Please note that Bambuser does not collect any personal data through our tracking library.
4. DataLayer - Extend your show analysis
You can have the Bambuser Live Video Shopping player pushing all events and interactions to the dataLayer. It gives you access to all the data the Bambuser cookie collects and enables a more in-depth analysis of the buying process: Which products are most in-demand, which products are purchased outside of the player, and information to support optimizing LVS content.
- The most common way to store events' data
- Easy to pick up event/interaction data from the data layer and feed that to any analytics systems
- Bambuser events you can easily recognize data from other tracking items
- Events/interactions are pushed instantly and include timeline data
Analytics tools such as Google Analytics, Adobe Analytics, Tealium, etc. that use the data layer object can pick up Bambuser events from there. Read more here.