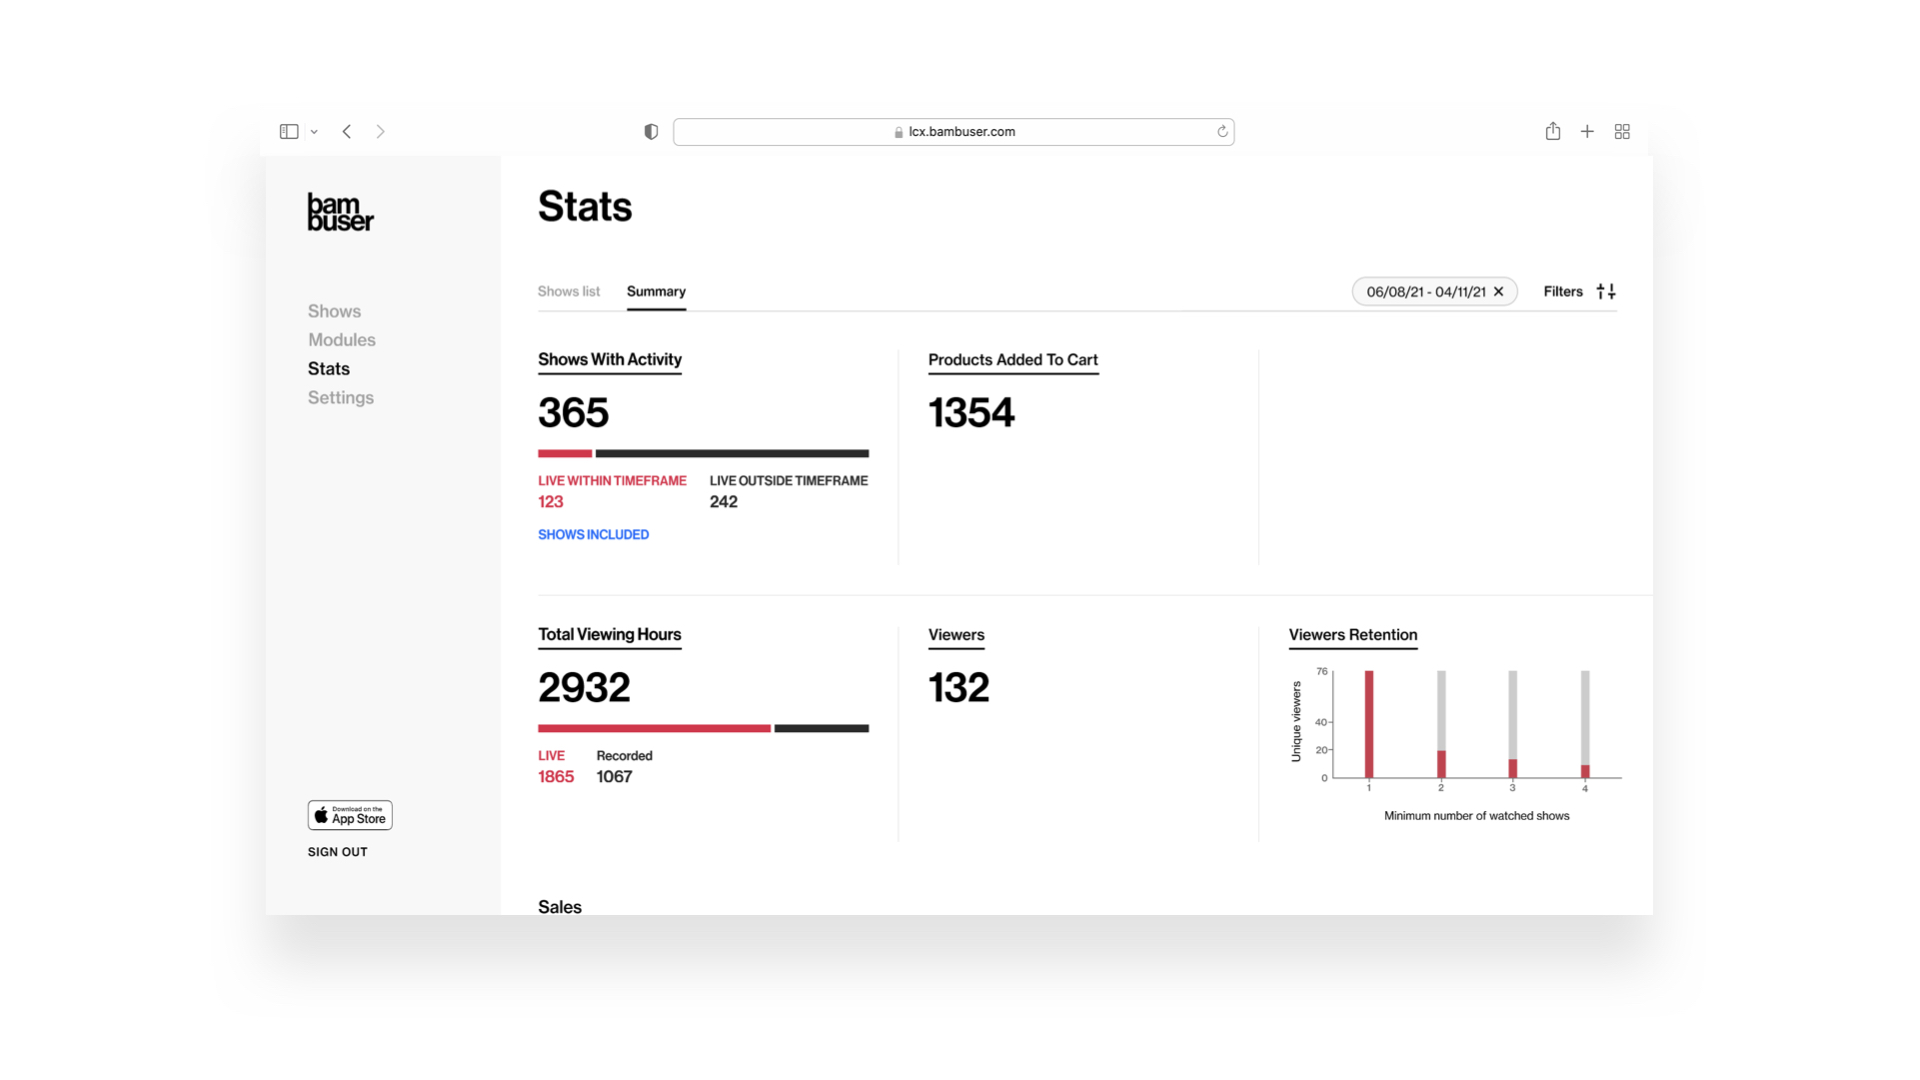
The stats summary page presents aggregated KPIs and statistics about the activity registered on any shows available on your site in a selected period of time. By clicking on Stats and then the tab Summary you will, by default, visualize the performance of the last three months.
Activity based
First and foremost, what do we categorize as an activity? We classify a show as “with activity” if there has been at least viewing or sales activity related to it. The dashboard is based on activity, or activity-centric, which means that we are including the activity registered in any shows that you have had available to be consumed in the selected period of time (e.g. we are not limiting to include only the shows that have been broadcast in the selected period).
Which KPIs are included?
- The number of shows with activity: Total and split between live during the timeframe and outside. For further information, you can click Shows included, read more below
- Products added to cart: How many products have been added to the cart
- Viewers: A sum of unique viewers per show
- Viewers retention: The graph to the right shows how many unique viewers have watched at least 1, 2, 3, or 4 shows in the selected period. The calculation is based on user id data that is stored for 365 days after the users’ last interaction with your show. For this reason, we might underestimate the retention value (viewers inactive for more than 365 days get a new user id and then they are considered new viewers). Please note that there are other circumstances where the viewers could get a new user id and so they would be counted as new viewers like, for example, if they clear cookies.
- Viewing hours: How many hours were watched in live & recorded, and total
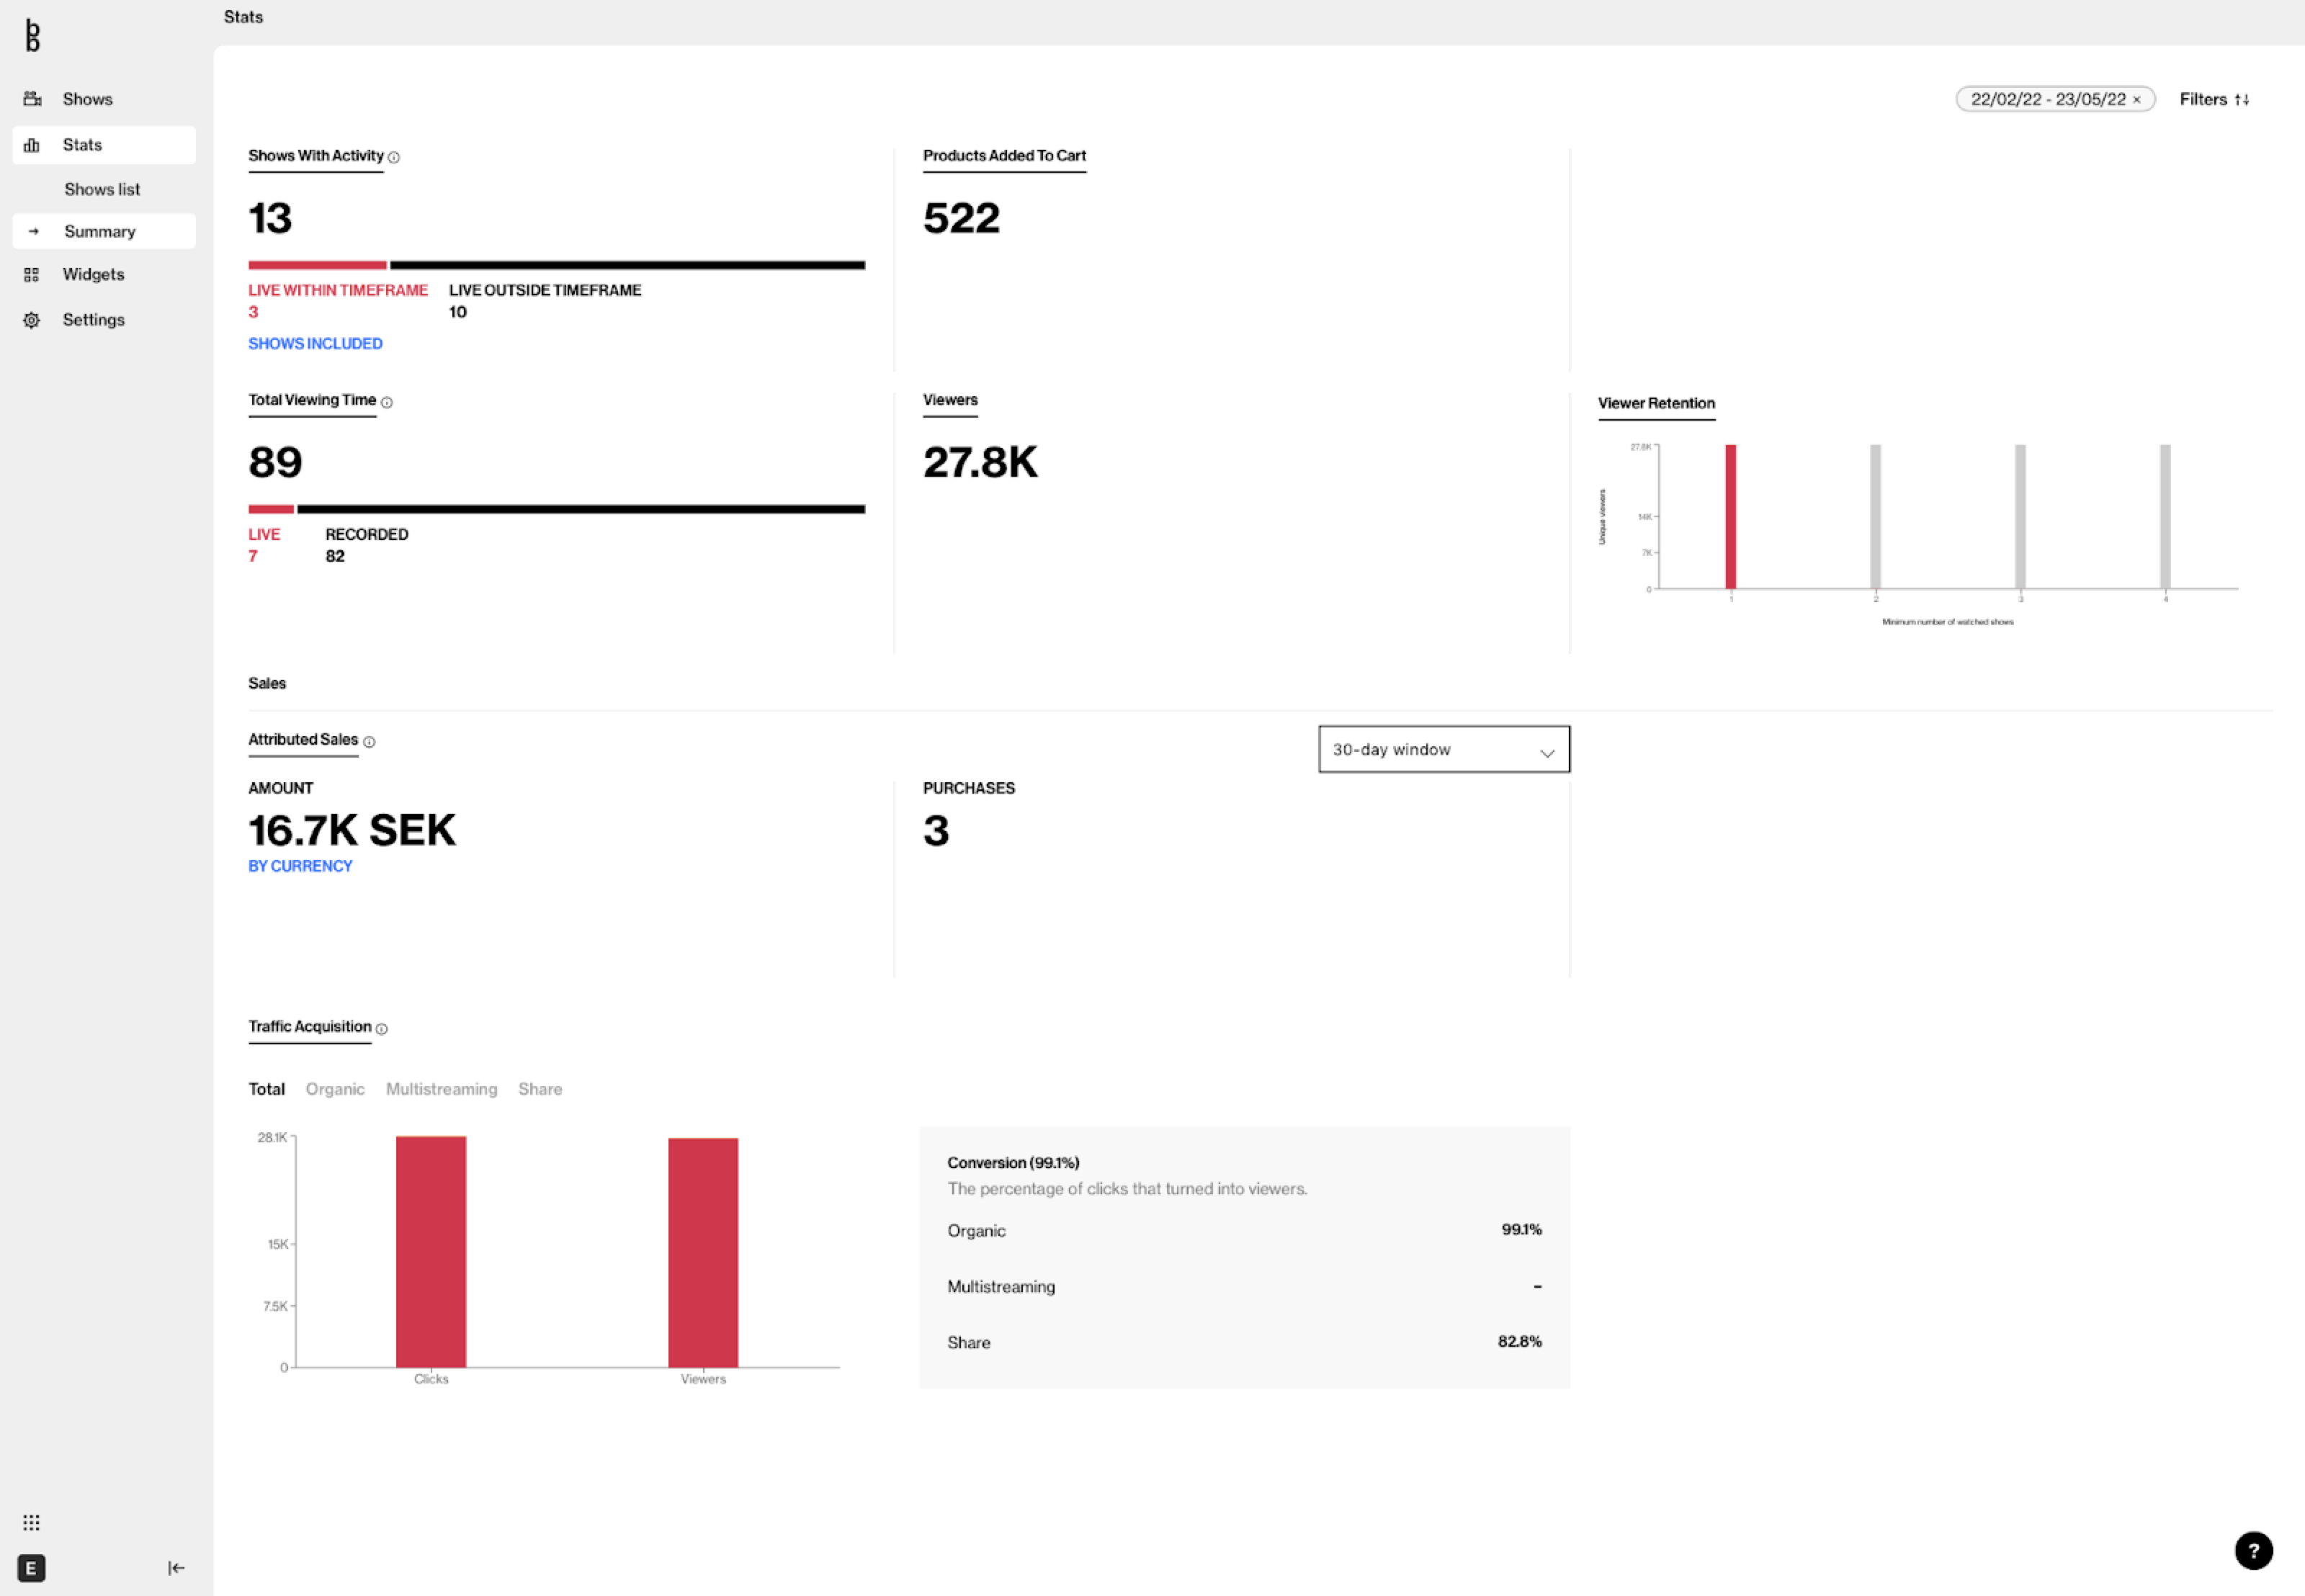
- Sales: Amount and number of purchases, the same KPI is available in the other stats pages today
Traffic acquisition overview
-
Graphical visualization of the clicks and viewers acquired in a selected period of time in total, by category, and subcategory
Conversion panel to quickly and easily evaluate the conversion (%) from click to the viewer in total, category, and subcategory
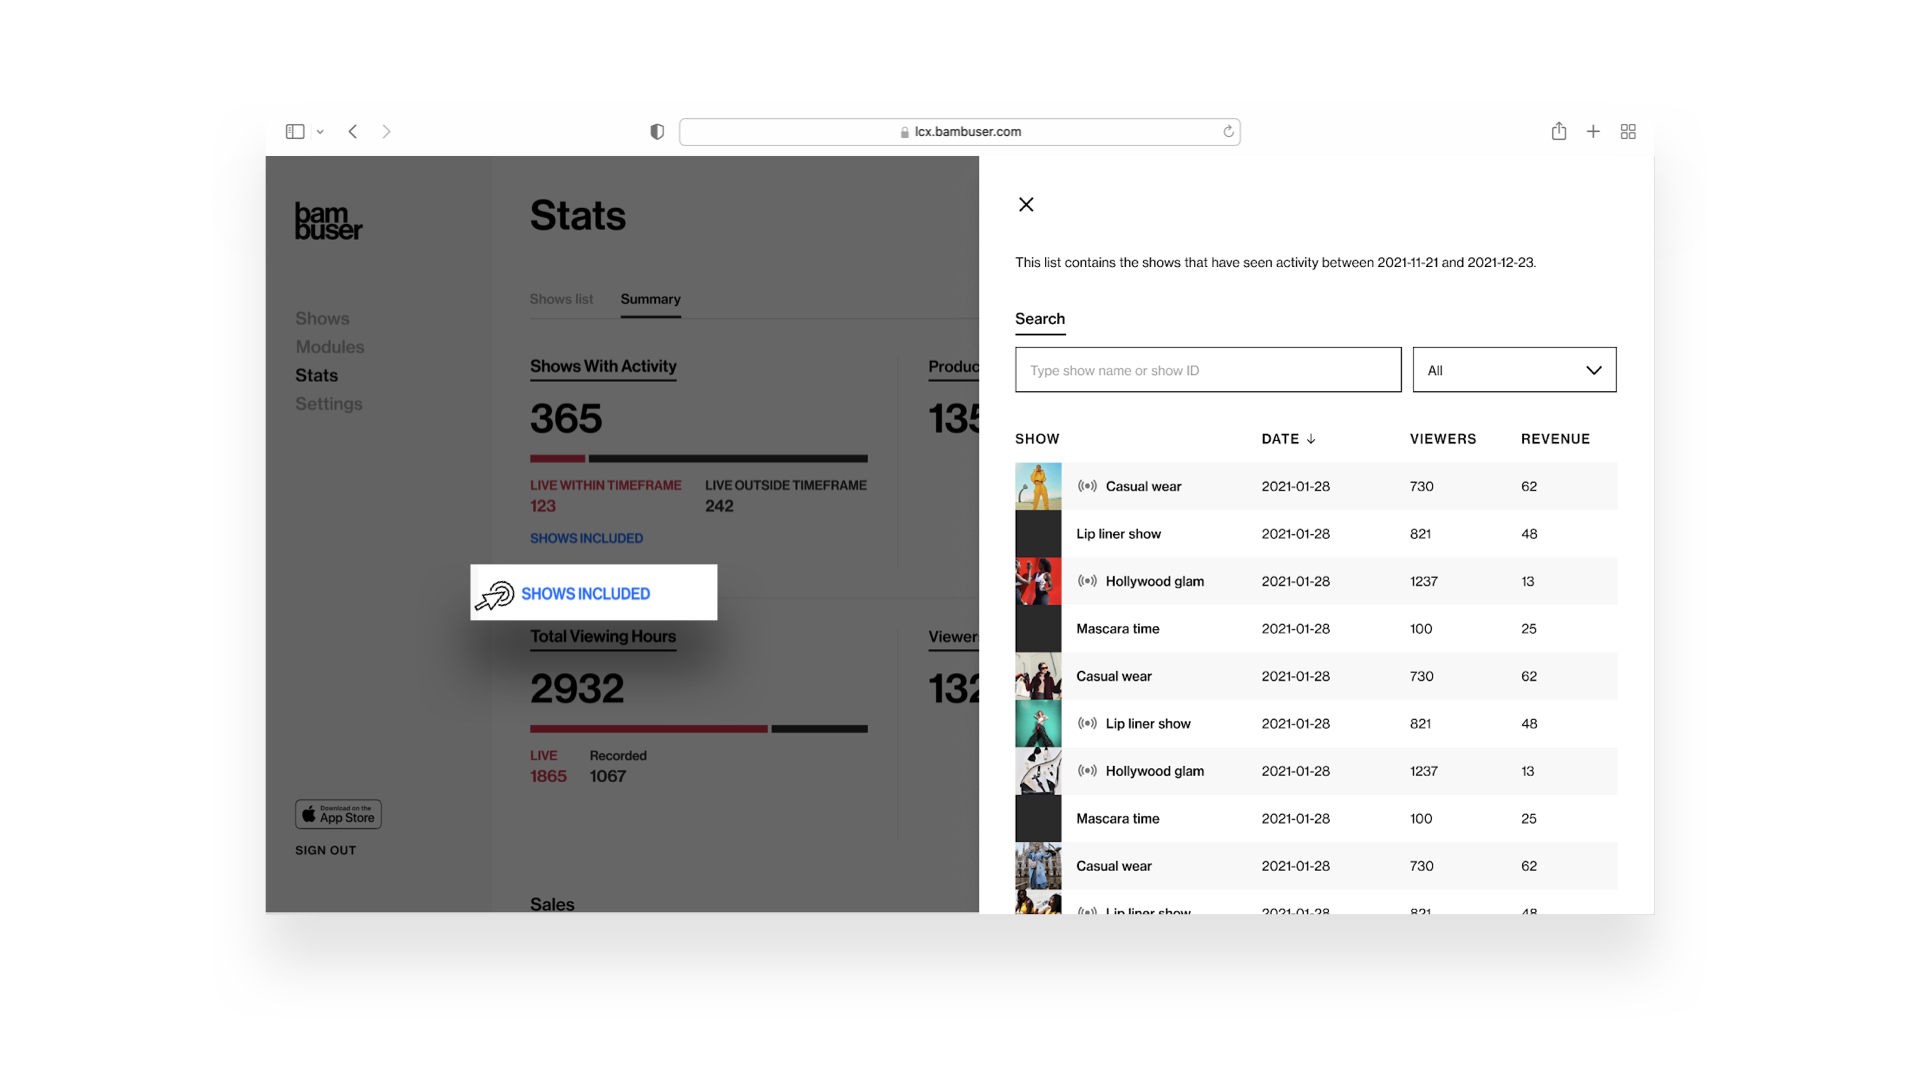
Shows included
By clicking on SHOWS INCLUDED you can see which shows are included in the overview and the viewers and sales they have had in the selected timeframe. You will then have the possibility to access the desired show reports by clicking on the items in that list.