- Go to Stats from the left menu on the dashboard
- Filter Stats by date range
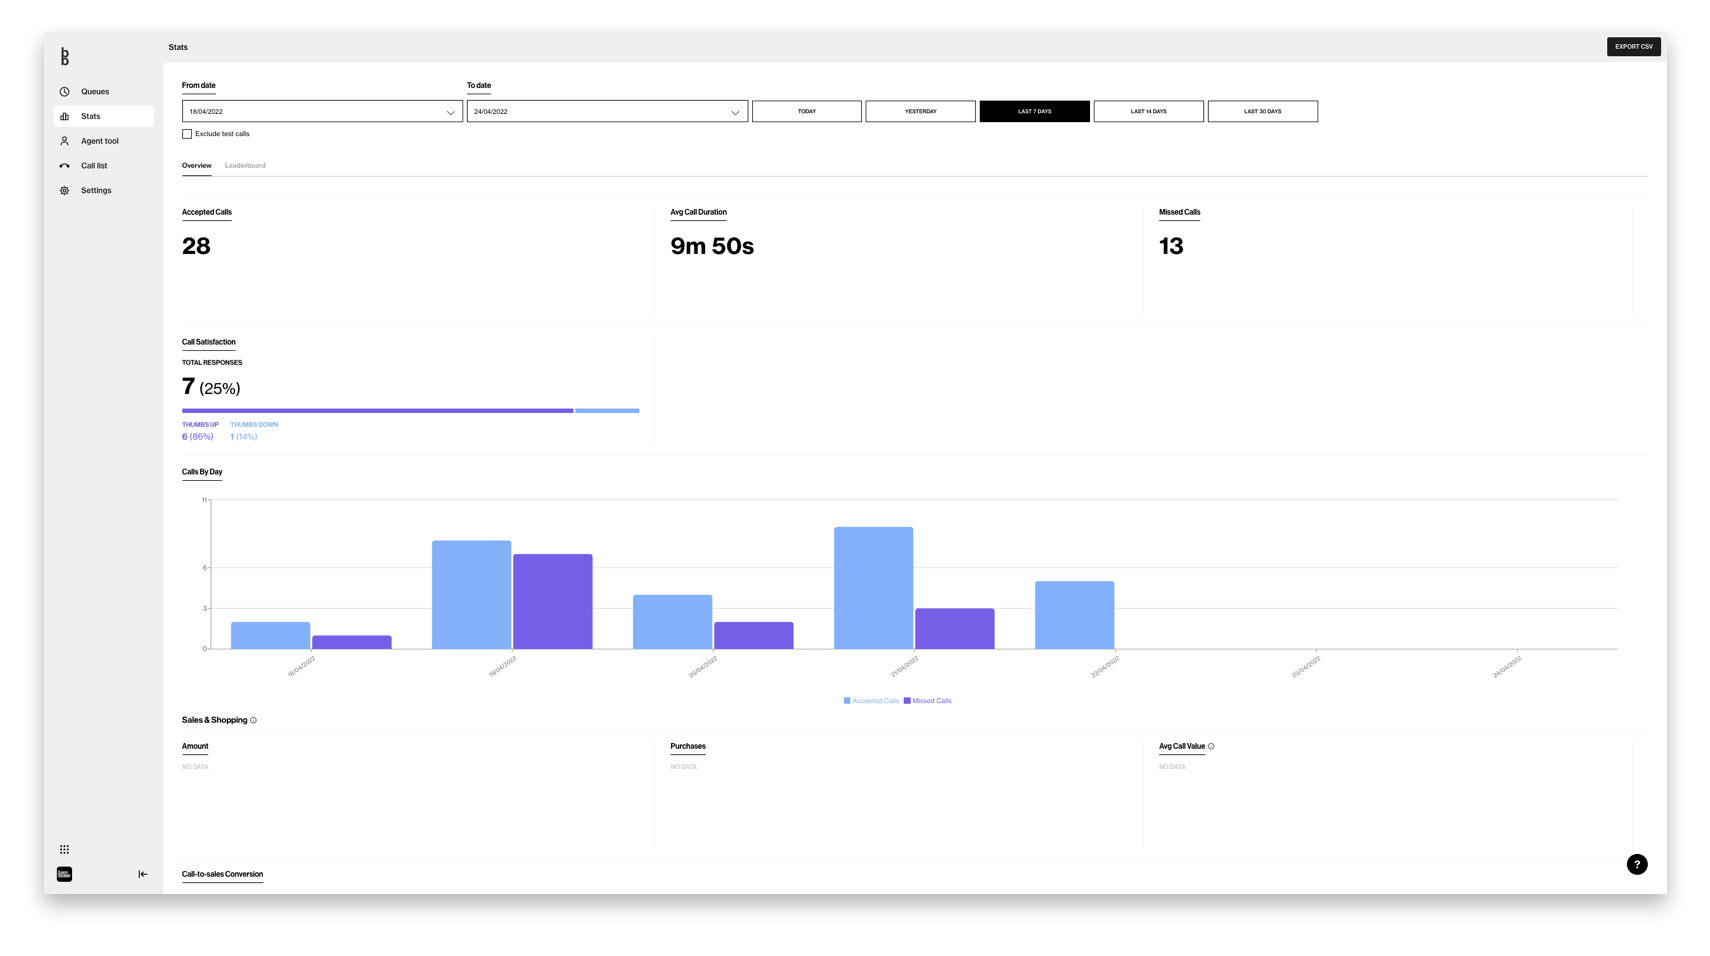
This will give you an overview of your Call Insights, covering:
Call metrics
- Accepted Calls Effective calls accepted (as a sanity check, if the call started but there is a technical problem or the call duration is less than 20 seconds long it will not be counted)
- Average Call duration The average duration of the accepted call
- Amount of Missed Calls A missed call is when a client entered a queue and waited more than 5 seconds without getting an answer
- Calls By Day graph The calls-by-day graph provides a visual overview of the number of accepted respectively missed calls per day during the selected time period.
Call Feedback metrics
The Call Feedback provides visibility of call satisfaction. Metrics will help you evaluate the average response for a predefined question of your choice.
The data consist of:
- Total Number of responses
- Percentage of calls that received feedback
- Split between ‘thumbs up’ vs ‘thumbs down’
Note
This data will be presented when the feature is activated. If you like to enable the poll with a custom question, reach out to your point of contact at Bambuser.
Sales metrics
The sales metrics are available only for clients with purchase tracking implemented. They refer to the calls that happened in the selected period of time and they are calculated considering a 7 days attribution window.
- Amount of revenue, possible to display grouped by currency
- Purchases Number of distinct purchases
- Average Call Value The total sum of sales (Amount) divided by the number of calls that led to a Purchase. Note: One call can result in more than one purchase.
- Call-to-sales Conversion graph This graph visualizes how many of the accepted calls had "add to cart" events and lead to an actual sale through a checkout. It is also possible to see the number of calls that had "add to cart" events but where no checkout/sale happened.
Shopping metrics
- Checked Out Products Number of products in the cart when a checkout happens
- Checked Out Value The summarised value of the products in the cart when a checkout happens
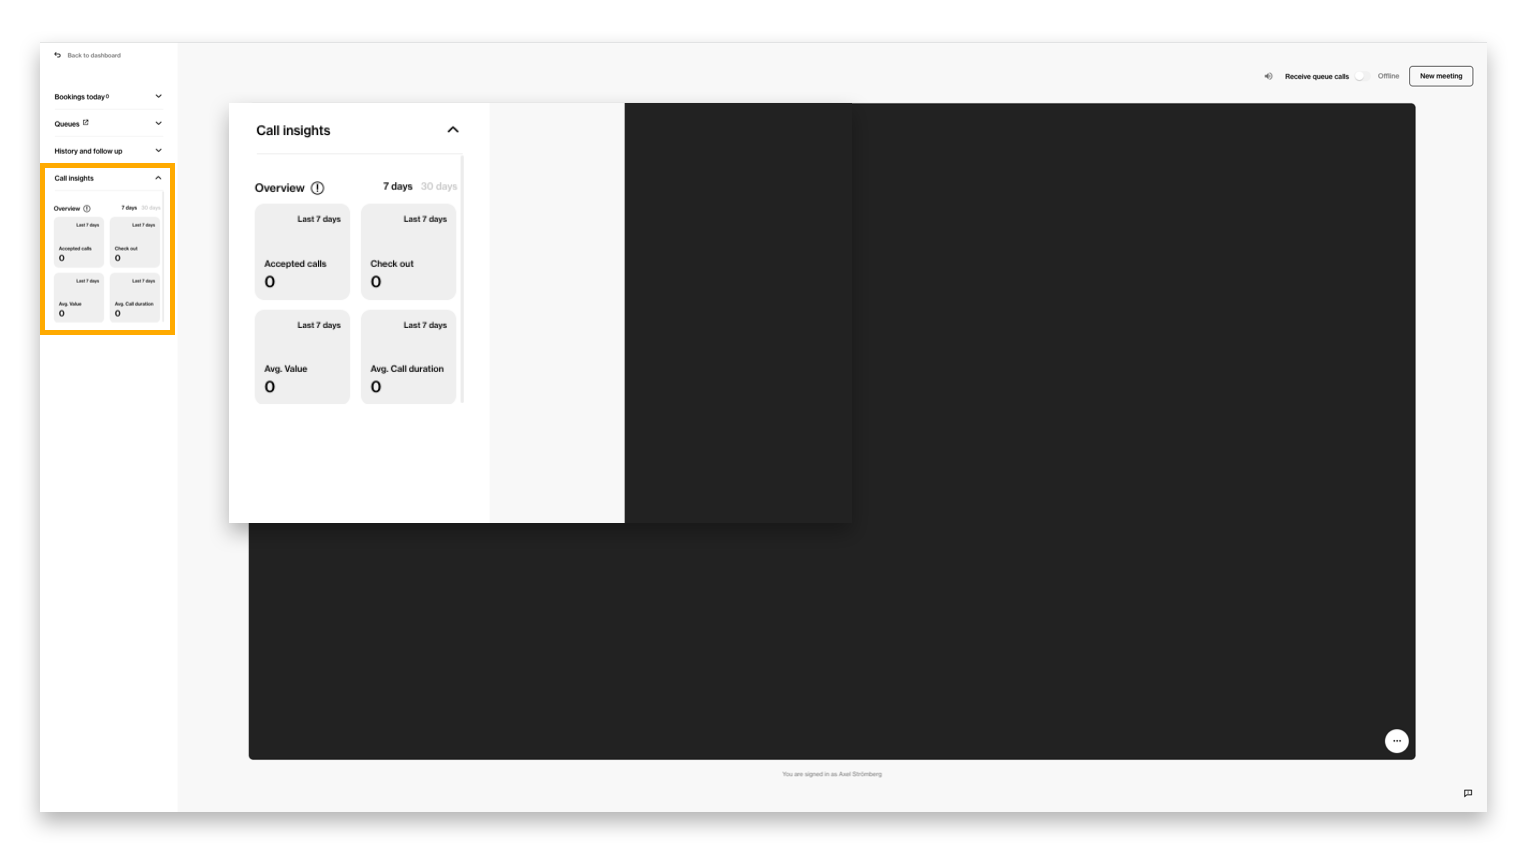
Call insights
Availability for agents to see their own performance in the Agent tool. The same metrics that are shown in the Agent leaderboard will be shown in the Agent tool.
- No. of accepted calls
- No. of calls with check out
- Avg. checkout value
- Avg. call duration
Agents will be able to see the aggregated data on a 7 or 30 days time interval.
CSV export
The CSV export gives you a downloadable report of the calls that took place during the selected time period, including for example agent name, queue name, call duration, and purchase information.
It is possible to include/exclude test calls and missed calls below the threshold (calls shorter than 20 seconds and missed calls with a waiting time in the queue that is less than 5 seconds) from the export.
To download the same data used in the stats pages the user needs to keep the default selection.