Table of Contents
1. What's next?2. Stats & performance2.1 KPIs to analyze2.2 Track your social media stream2.3 Track your Live engagement2.4 Track your Post engagement2.5 Track your interaction KPI's3. Edit tool: Remake, Reuse, Relaunch3.1 Enable the show to your product page4. Widgets4.1 Increase viewers with FAB4.2 Make it easy with Channels5. Broadcast Report 5.1 KPIs to observe6. Education center1. What's next?
That's it, for now. A big congratulations from the Bambuser for launching your first Live Video Shopping show - impressive! Plan your upcoming shows, incorporate your livestreaming content with the commercial calendar, and promote previous shows from a 360° perspective. Let your imagination run wild!
This last section will highlight how you can analyze, optimize and work with the content you create going forward.
2. Stats & performance
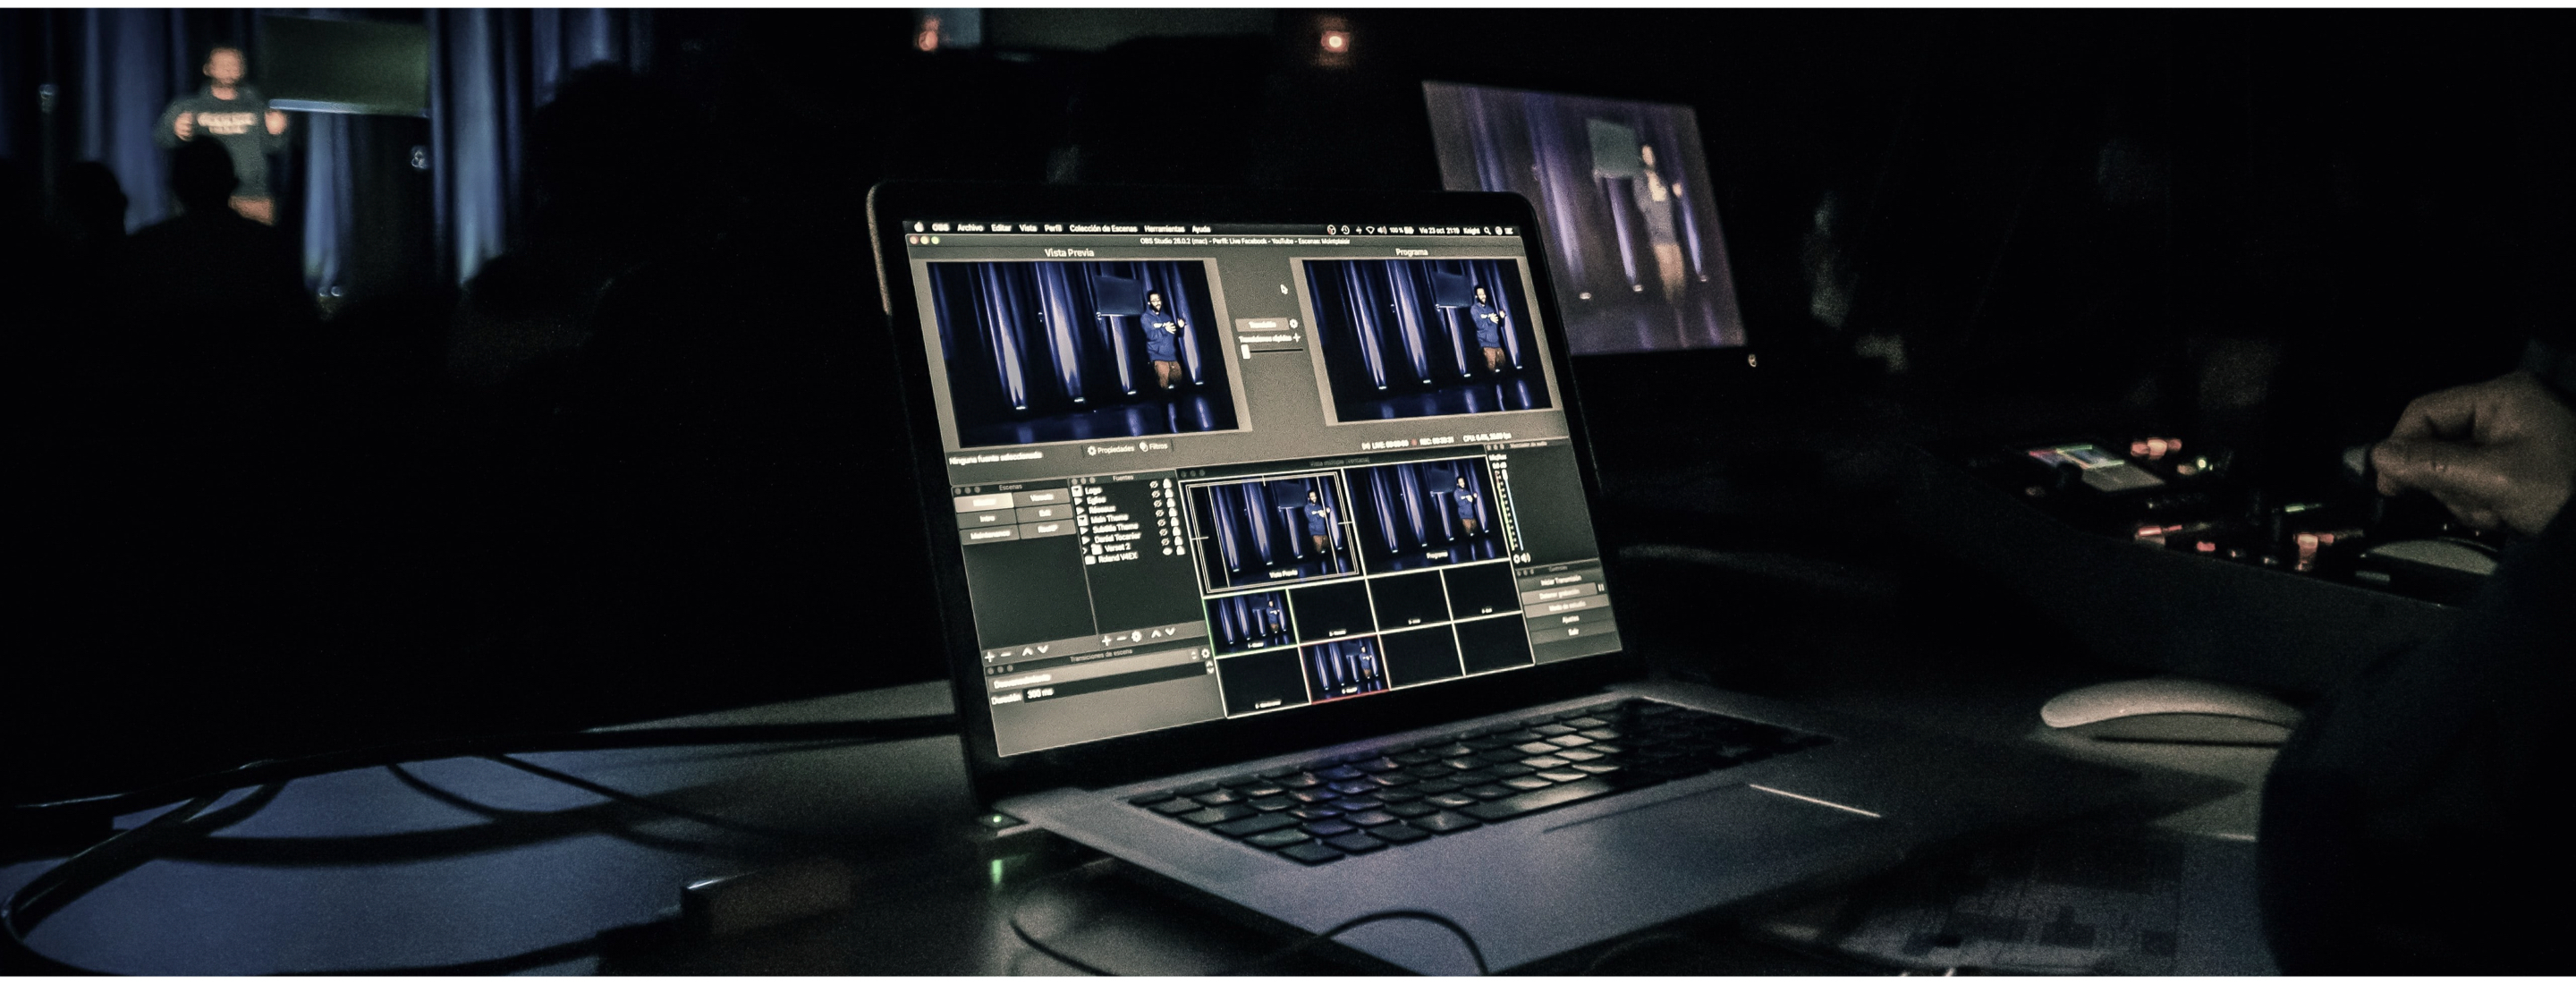
After your live show has finished, you will be able to view and download its stats by selecting Stats in the menu. You can see detailed stats or stats based on activity over a longer timeframe by hitting Summary at the top and picking a show by selecting its title. A screen will appear with information about that show. Data will include live, recorded and total numbers.
2.1 KPIs to analyze
You can analyze a lot of KPIs as follows:
- Time and duration
- Number of viewers
- Purchases (if conversion tracking is implemented accordingly)
- Add to cart (if you have cart integration)
- Likes
- Chat
- Mobile vs Desktop engagement
- Read more here
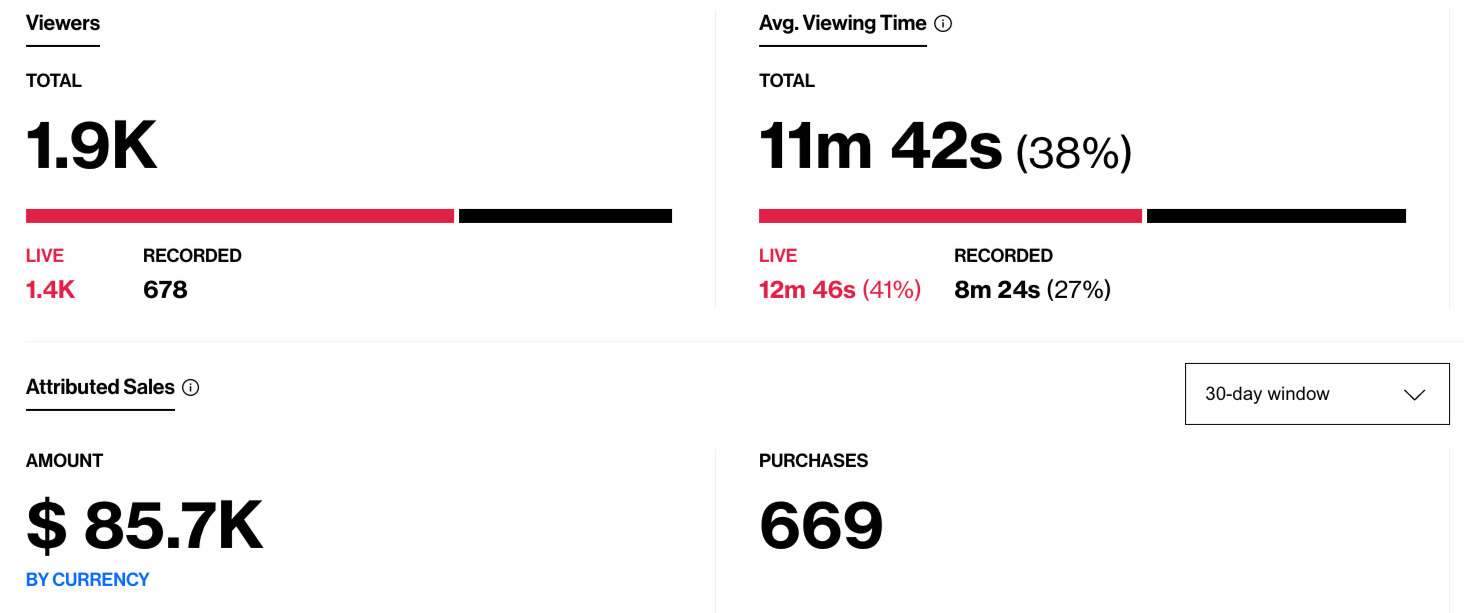
For viewers and viewing time you can also examine the following:
- Live stats from the actual live show
- Recorded stats from all views of the recorded show (updated every 24 hours)
- Total stats of both live and recorded
2.2 Track your social media stream
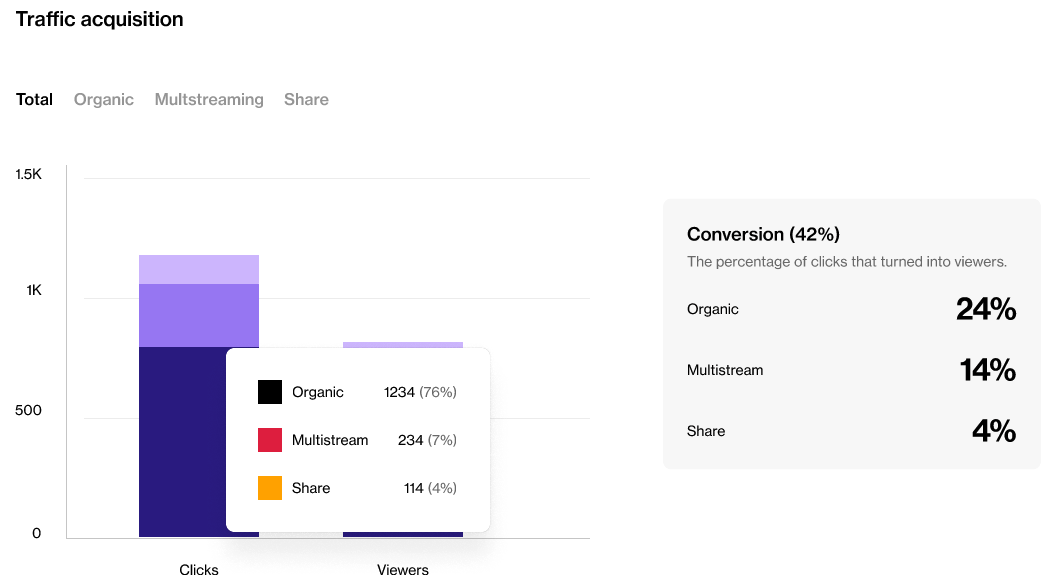
If you are streaming simultaneously to for instance Facebook, YouTube & more, you can analyze viewers' that clicked on the chosen streaming platform and examine the funnel. The stats provide visibility, both through graphs and a conversion panel, on clicks, viewers, click to viewer conversion at group and sub-group categories level. The different traffic sources have been organized with the following hierarchy.
2.3 Track your Live engagement
The live engagement graph showcases the viewers' interaction minute by minute of the show. Learn from the curves and identify what content triggers their actions.
2.4 Track your Post-live engagement
The post-live engagement graph showcases the viewers' interaction after the show has been live. You can filter between different time periods and select sum, max, and average.
2.5 Track your interaction KPI's
Add-to-cart - Showcase how well the host is selling the products and if the targeted viewers are attracted to the live show (only with cart integration!)
Chat - Live shopping is two-way communication, and the chat rate indicates if you've been successful with the interaction with the viewers
Likes - Indicate how engaged the viewers are and if they like what they see
Device - Divided between desktop and mobile
3. Edit tool: Remake, Reuse, Relaunch
Great content lives forever! Promote your recorded shows that feature particular products on their specific page. It can be great educational content for those site visitors who are unsure about the product and want to learn more about it.
3.1 Enable the show to your product page
Add it below the product and promote it as "Watch to learn more". Use the time stamp "share link" to ensure it takes the visitor to the time when that product is featured in the show. Remove unwanted sections, divide them into minor clips that can be embedded and/or shared elsewhere and keep interactivity. This can also be utilized using our API, read more here.
4. Widgets
If you haven't used our features yet, there is still time to launch it now!
4.1 Increase viewers with FAB
Implement the Floating Action Button (GIF below) to increase the awareness of your live shows.
- Automatically invite site browsers to join your live shows
- Automatically displays a video preview of the show
- Visitors to choose to keep watching or minimize the live show
- Explore the feature Floating action button
4.2 Make it easy with Channels
Channels is a pre-built live show library that enables you to add shows without back-end support. By utilizing Channels, you do not have to make code changes every time you want to display a new show on your website. Instead, you can manage your show library directly from the Bambuser Dashboard
5. Broadcast Report
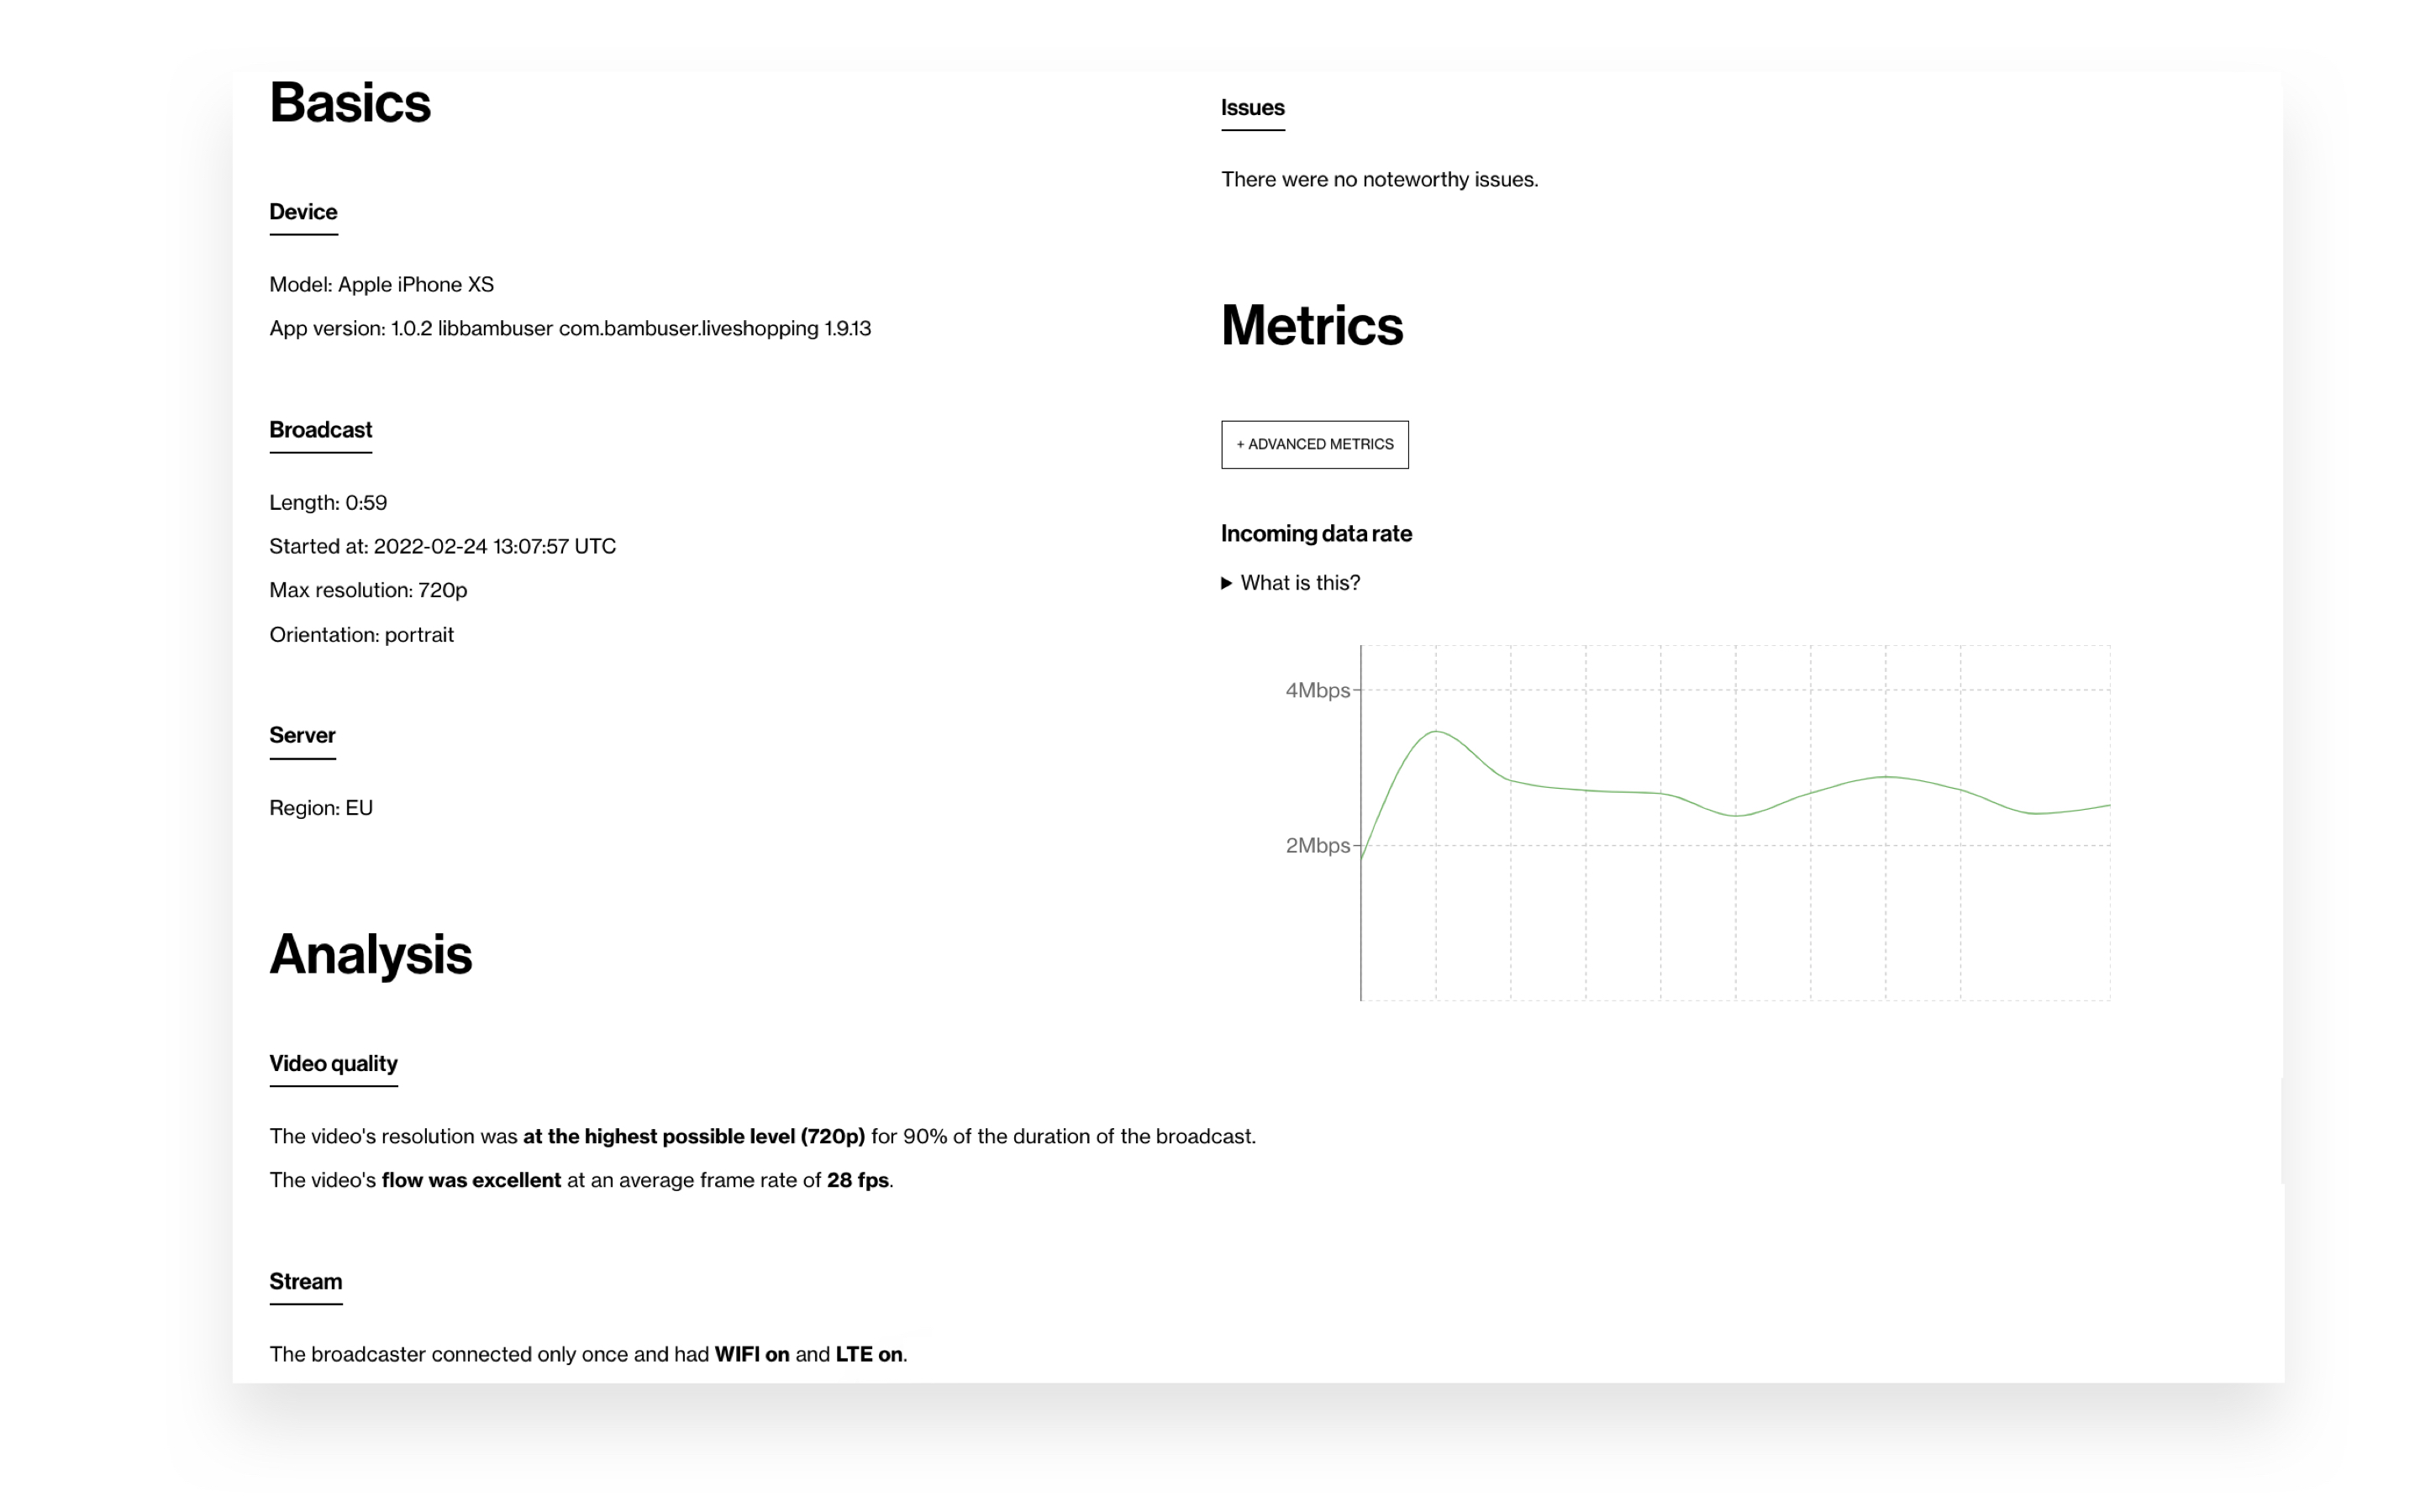
After the live has finished a Broadcast Report with technical data from the show will be available. Broadcast Reports include information about streaming quality, data rates, and other technical analyses good for checking the health of the stream. Broadcast Report can be found under the tab “Edit”. It appears once the live is ended.5.1 KPIs to observe
The most important technical KPIs to examine is:
- Analysis
- Metrics
Here you can find information about the streaming quality, how good the resolution was, and how stable your connection was. The incoming data rate measure your network stability. This should always be as straight as possible and at least over 4mb/s. The picture below is an example of a poor connection.
6. Education center
A friendly reminder of our Knowledge base. Bambuser provides an extensive knowledge base to educate, guide, and support you and the team to operate with the Bambuser tool as smoothly as possible. Educate yourself and your teammates while browsing with our tool.
Once again - Congratulations and welcome onboard!